
Understanding how your website performs against competitors, across different time periods, or between various traffic sources remains one of the most critical skills for digital marketers and business owners in 2026. The ability to compare website visits meaningfully provides insights that drive strategic decisions, reveal growth opportunities, and identify potential problems before they escalate. However, with the evolution of privacy regulations, cookieless tracking technologies, and the emergence of AI-driven search engines, the methods and tools we use to evaluate traffic have fundamentally changed.
Why You Need to Compare Website Visits
Digital marketing shifts constantly. What worked last quarter may not deliver results today, and understanding these changes requires systematic comparison of traffic patterns.
When you compare website visits across different dimensions, you gain visibility into trends that raw numbers alone cannot reveal. A sudden spike might indicate successful content, viral social sharing, or simply spam traffic that requires immediate attention. Similarly, a gradual decline could signal algorithm changes, technical issues, or shifting user preferences.
Strategic Benefits of Traffic Comparison
- Identify seasonal patterns and prepare marketing campaigns accordingly
- Validate marketing investments by comparing pre- and post-campaign traffic
- Detect technical issues through unusual drop-offs in specific segments
- Benchmark against industry standards to set realistic growth targets
- Understand audience behaviour shifts across devices, locations, and demographics
European businesses face additional considerations when choosing comparison methods. Tools that rely on extensive cookie tracking not only create friction through consent banners but may also transfer data outside the EU, creating compliance challenges.
Key Metrics for Meaningful Traffic Comparison
Not all visits hold equal value. A thorough comparison strategy examines both quantitative and qualitative dimensions of your website traffic.
Visitor Volume vs. Visitor Quality
Raw visitor counts provide limited insight without context. Two websites with identical monthly visits may have drastically different business outcomes based on visitor quality.
Metric Type | What It Measures | Why It Matters |
|---|---|---|
Total Visits | Overall traffic volume | Indicates reach and visibility |
Unique Visitors | Individual people visiting | Shows actual audience size |
Pageviews per Visit | Engagement depth | Reveals content relevance |
Bounce Rate | Single-page sessions | Indicates landing page quality |
Session Duration | Time spent on site | Measures content value |
When you compare website visits, prioritize engagement metrics alongside volume. A decrease in total visits paired with increased session duration might actually indicate improved targeting, attracting fewer but more relevant visitors.

Traffic Source Segmentation
Understanding where visitors originate reveals which channels deserve increased investment and which require optimization or abandonment.
Primary traffic sources to compare:
- Organic search traffic
- Direct visits
- Referral sources
- Social media platforms
- Email campaigns
- Paid advertising
Organic traffic deserves particular attention as it represents visitors actively seeking your content or solutions. When comparing periods, analyze whether organic traffic maintains its proportion or if you’re becoming increasingly dependent on paid channels.
The rise of AI search engines introduces new complexity. Platforms like ChatGPT and Perplexity now drive traffic through citations and recommendations, requiring new tracking approaches to understand this emerging source.
Methods to Compare Website Visits Effectively
Different comparison approaches serve different analytical needs. Selecting the right method depends on your specific questions and business context.
Time-Based Comparisons
Comparing equivalent time periods reveals trends, validates initiatives, and helps forecast future performance.
Week-over-week comparisons work well for identifying immediate impacts of changes or campaigns. However, they can be noisy, affected by day-of-week variations and one-time events.
Month-over-month analysis smooths out weekly fluctuations whilst remaining responsive to recent changes. This method suits businesses with regular monthly cycles or recurring campaigns.
Year-over-year comparison accounts for seasonal variations, providing the clearest view of genuine growth. Retail sites, tourism platforms, and seasonal services particularly benefit from annual comparisons.
When you compare website visits across time periods, ensure you account for external factors. Global shifts in search behavior and AI adoption fundamentally alter traffic patterns, making historical data less predictive than previously.
Segment-Based Comparisons
Analyzing visitor segments separately often reveals insights hidden in aggregate data.
- Geographic segments: Compare performance across countries, regions, or cities
- Device categories: Analyze mobile versus desktop traffic separately
- New versus returning visitors: Understand acquisition versus retention
- Landing page groups: Compare content categories or product lines
For European businesses, geographic segmentation becomes particularly valuable when expanding across borders. Traffic patterns in Germany may differ significantly from those in Spain or Italy, requiring localized strategies.
Privacy-First Approaches to Traffic Comparison
Traditional analytics platforms built for a cookie-dependent world now create compliance burdens and data accuracy issues. Modern alternatives enable detailed comparison without privacy compromises.
Cookieless Tracking Advantages
When you eliminate cookies, you simultaneously remove consent banners, improve page speed, and simplify data governance. More importantly, you gain more accurate data. Cookie deletion, browser restrictions, and consent refusals create gaps in traditional analytics that skew comparisons.
Cookieless platforms track visits through privacy-respecting methods that don’t require individual user identification. This approach provides aggregate insights perfect for comparative analysis whilst respecting visitor privacy.
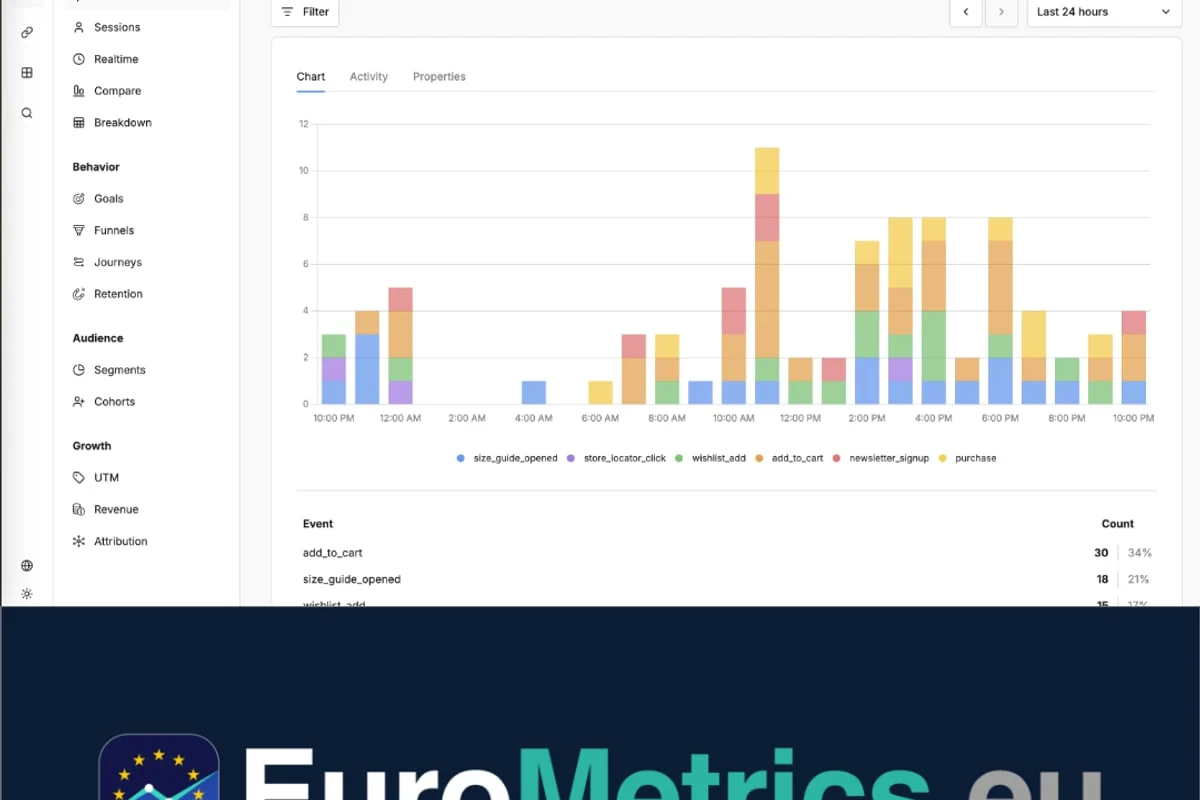
European businesses benefit from tools designed specifically for GDPR principles, ensuring data never leaves EU jurisdictions. When you compare website visits using platforms with EU-hosted infrastructure, you maintain complete data sovereignty.
Server-Side Tracking Benefits
Browser-based tracking faces increasing limitations through ad blockers, privacy extensions, and intelligent tracking prevention. Server-side methods capture more complete data, improving comparison accuracy.
This architectural difference means server-side analytics typically report 15-30% more visits than client-side tracking, particularly for privacy-conscious audiences common in European markets.
Benchmarking Against Industry Standards
Internal comparisons reveal your own trends, but external benchmarking provides context about competitive positioning and market opportunities.
Finding Relevant Comparison Data
Industry reports, trade associations, and analytics platforms publish aggregate benchmarks for various sectors. However, these benchmarks require careful interpretation.
Factors affecting benchmark relevance:
- Industry specificity (broad vs. niche categories)
- Geographic market (global vs. regional)
- Business model (B2B vs. B2C)
- Company size and maturity
- Measurement methodology
A European SMB should compare against similar European SMBs rather than global enterprise averages. Size, market maturity, and regulatory environment all influence what constitutes “normal” traffic patterns.
When external benchmarks are unavailable or unreliable, consider competitive analysis through third-party tools. Whilst never perfectly accurate, these platforms provide directional insights into competitor traffic trends.
Tools and Technologies for Traffic Comparison
The right analytics platform transforms raw data into actionable comparisons. Key capabilities to evaluate include:
Feature | Why It Matters | Questions to Ask |
|---|---|---|
Real-time data | Enables immediate response | How quickly does data appear? |
Custom date ranges | Allows flexible comparisons | Can I compare any two periods? |
Segment filtering | Isolates specific visitor groups | What dimensions can I filter? |
Export capabilities | Supports deeper analysis | Can I access raw data? |
Multi-property view | Compares multiple sites | Can I track several domains? |
Traditional analytics platforms often overwhelm users with complexity whilst simultaneously creating privacy friction. Modern alternatives prioritize simplicity without sacrificing depth.
For businesses managing multiple properties across languages or regions, consolidated dashboards that enable cross-property comparison become essential. Comparing your French site performance against your German site reveals localization effectiveness and regional preferences.
Advanced Comparison Techniques
Beyond basic metrics, sophisticated analysis techniques reveal deeper insights about visitor behaviour and business performance.
Cohort Analysis
Grouping visitors by shared characteristics or first-visit timing enables powerful longitudinal comparisons. You might compare users who first visited during a specific campaign against those from organic search, tracking how each cohort behaves over subsequent months.
This technique particularly suits subscription businesses, SaaS platforms, and content sites with returning user models.
Attribution Comparison
When visitors interact with multiple touchpoints before converting, attribution analysis reveals which channels deserve credit. Comparing first-touch attribution (what brought them initially) against last-touch attribution (what preceded conversion) identifies both awareness and conversion drivers.
Multi-touch attribution models distribute credit across the customer journey, providing more nuanced comparison between channels than simple visit counts.

Statistical Significance Testing
When you compare website visits between periods or segments, random variation can create misleading patterns. Statistical testing determines whether observed differences represent genuine changes or normal fluctuation.
For smaller sites with limited traffic, week-to-week variations may rarely reach statistical significance. Understanding this limitation prevents overreacting to noise whilst remaining alert to meaningful signals.
Common Pitfalls When Comparing Traffic
Even experienced analysts make errors that compromise comparison validity. Awareness of these pitfalls improves decision quality.
Comparing unequal time periods represents the most frequent mistake. Comparing a 28-day month against a 31-day month creates artificial differences. Always use equal-length periods or normalize to daily averages.
Ignoring external factors leads to incorrect attribution. Algorithm updates, competitor campaigns, seasonal events, and market conditions all affect traffic independently of your actions.
Focusing solely on volume metrics whilst ignoring quality creates false confidence. Traffic increases mean little if engagement decreases simultaneously.
Insufficient sample sizes make patterns unreliable. Small sites need longer comparison periods to generate meaningful insights, as individual visitor behavior creates more noise than signal.
Data inconsistencies from tracking changes, implementation errors, or platform migrations corrupt comparisons. When moving to new analytics platforms, run both systems parallel during transition to understand any measurement differences.
Preparing for AI Search Engine Traffic
The emergence of generative AI search engines fundamentally changes how users discover content. Optimizing for these platforms requires different strategies than traditional SEO whilst affecting how we compare website visits.
Tracking AI-Driven Traffic
Current analytics platforms may categorize AI search traffic as direct visits, referrals, or organic search depending on implementation. Specialized tools for monitoring AI search visibility help isolate this traffic source for separate analysis.
When you compare website visits over time, account for the growing proportion arriving through AI recommendations rather than traditional search results. This shift affects interpretation of “organic” traffic trends.
Attribution Challenges
AI search engines often present information without sending users to source websites, creating attribution complexity. Citations and references may generate brand awareness without producing immediate visits, requiring longer attribution windows and alternative success metrics.
Creating Your Comparison Framework
Systematic traffic comparison requires structured processes rather than ad-hoc analysis. Establish regular reporting rhythms aligned with business cycles.
Weekly reviews identify immediate issues requiring rapid response. Focus on anomaly detection rather than deep analysis.
Monthly analysis provides sufficient data for pattern recognition whilst remaining timely enough to inform tactical adjustments. Most businesses find monthly comparison cadence optimal for regular decision-making.
Quarterly strategic reviews incorporate traffic trends into broader business planning. Compare performance against goals, update forecasts, and adjust resource allocation.
Annual retrospectives reveal long-term trends obscured by shorter-term noise. Year-end comparison identifies what genuinely moved metrics versus temporary fluctuations.
Document your comparison methodology, ensuring consistency across reporting periods. Standardized dashboards, saved segments, and templated reports reduce analysis time whilst improving reliability.
Integrating Traffic Comparison With Other Metrics
Website visits exist within broader business context. Effective analysis connects traffic patterns to downstream outcomes.
Conversion Rate Interaction
When you compare website visits alongside conversion rates, four scenarios emerge:
- Increasing traffic, stable conversion: Successful growth
- Increasing traffic, declining conversion: Quality problems
- Declining traffic, increasing conversion: Improved targeting
- Declining traffic, declining conversion: Serious issues
This matrix approach prevents misleading conclusions from examining metrics in isolation.
Revenue and Business Impact
For commercial sites, traffic comparison ultimately serves revenue goals. Connect visit patterns to:
- Lead generation volumes
- Sales conversion rates
- Average order values
- Customer lifetime value
- Marketing efficiency metrics
A campaign that doubles traffic whilst halving average order value may harm rather than help business performance. Supporting your analysis with diverse data points creates more reliable strategic insights.
Data Quality and Reliability Considerations
Comparison accuracy depends on measurement consistency. Several factors affect data reliability in modern analytics.
Bot and Spam Traffic
Automated visits distort comparisons when present unevenly across periods. Traffic spikes from bot attacks or spam referrals create false growth signals whilst diluting engagement metrics.
Quality analytics platforms implement bot filtering, but methodologies vary. When comparing across platforms or after changing tools, verify that bot treatment remains consistent.
The Free Cookie Scanner helps identify unexpected trackers that may indicate compromised data collection or unauthorized third-party access affecting measurement accuracy.
Tracking Implementation Changes
Any modification to tracking code, tag management, or analytics configuration potentially affects measurements. Document all implementation changes with dates to identify when data consistency breaks.
When comparing periods spanning implementation changes, either exclude the transition period or note the limitation in your analysis.
Data Processing Differences
Analytics platforms apply various processing rules, filters, and calculations. Understanding these differences matters when comparing:
- Different analytics platforms against each other
- Historical data after platform migrations
- Internal analytics against third-party estimates
These methodological variations explain why multiple tools rarely report identical numbers for the same website.
Reporting and Communication Best Practices
Effective comparison insights require clear communication to stakeholders with varying analytical sophistication.
Use visualization to make patterns immediately apparent. Line charts excel at showing trends over time, whilst bar charts effectively compare distinct categories.
Provide context alongside numbers. Stating “visits increased 23%” means little without explaining whether this represents success, expected seasonality, or concerning over-reliance on paid traffic.
Highlight actionable insights rather than dumping data. Decision-makers need clear recommendations based on your analysis, not raw metrics requiring their own interpretation.
Acknowledge limitations in your data or methodology. Transparent communication about uncertainty builds trust and prevents overconfident decisions based on incomplete information.
Frequently Asked Questions
How often should I compare website visits?
The optimal comparison frequency depends on your traffic volume and business cycle. Sites with thousands of daily visitors benefit from weekly comparisons to quickly identify issues. Smaller sites with limited traffic should focus on monthly or quarterly comparisons when sample sizes become meaningful. Establish regular reporting rhythms aligned with decision-making cycles rather than arbitrary calendar boundaries.
What is a good website visit growth rate?
Healthy growth rates vary dramatically by industry, business maturity, and market conditions. Early-stage businesses might achieve 20-50% monthly growth through aggressive marketing, whilst established sites may consider 10-15% annual growth successful. Rather than chasing arbitrary benchmarks, compare your growth against strategic goals and available resources. Sustainable growth that maintains or improves engagement quality exceeds unsustainable spikes followed by declines.
Can I accurately compare traffic before and after changing analytics platforms?
Platform migrations typically create measurement inconsistencies that compromise direct comparison. Different platforms define sessions, apply bot filtering, and process data using varying methodologies. When changing platforms, run both systems parallel for at least one full month to understand measurement differences. Use this overlap period to establish conversion factors, then apply appropriate adjustments when comparing historical data. Focus comparisons within single platforms whenever possible.
How do I compare website visits when traffic sources change?
When traffic composition shifts dramatically through new channels, campaigns, or strategies, segment-level comparison provides clearer insights than aggregate metrics. Analyze each traffic source separately to understand performance within consistent categories. For example, compare organic search month-over-month independently from paid search growth. This approach isolates genuine performance changes from simple traffic mix shifts.
What tools help compare competitor website traffic?
Third-party competitive intelligence platforms estimate competitor traffic using panel data, ISP partnerships, and algorithmic models. Whilst never perfectly accurate, tools like SimilarWeb and Semrush provide directional insights into competitor trends. Treat these estimates as approximate rather than authoritative, focusing on relative changes rather than absolute numbers. Evaluating source reliability remains critical when using any external data for strategic decisions.
How does cookieless tracking affect traffic comparison accuracy?
Cookieless tracking typically provides more accurate data than cookie-based methods because it avoids data loss from cookie deletion, consent refusals, and browser restrictions. When you compare website visits using cookieless platforms, you eliminate one major source of measurement inconsistency. However, ensure your implementation remains stable across comparison periods, as any tracking changes affect data consistency regardless of methodology.
Comparing website visits effectively requires combining reliable measurement infrastructure with analytical rigour and business context. The shift toward privacy-respecting, cookieless analytics actually improves comparison accuracy whilst simplifying compliance for European businesses. If you’re ready to compare website visits using a platform built specifically for European requirements with 100% EU hosting and no cookie consent complications, EuroMetrics provides real-time dashboards designed for clarity rather than complexity, helping you focus on insights that drive growth.