
Understanding how visitors interact with your website has become essential for digital success in 2026. Google web metrics provide the foundation for measuring everything from page views to conversion rates, offering insights that drive business decisions. Yet many European businesses find themselves caught between the need for detailed data and growing concerns about privacy compliance. Web measurement has shifted dramatically, with cookieless tracking and data sovereignty becoming central considerations alongside traditional performance indicators.
What Are Google Web Metrics and Why They Matter
Google web metrics encompass a broad range of measurements that track how users discover, navigate, and engage with your website. These metrics include traffic sources, bounce rates, session duration, conversion rates, and page performance indicators that collectively paint a picture of your digital presence.
The term “Google web metrics” has become somewhat synonymous with web analytics itself, largely due to the dominance of certain platforms in the market. However, the fundamental measurements remain consistent across platforms: understanding who visits your site, how they arrived, what actions they take, and whether they complete desired goals.
Core Performance Indicators Every Business Should Track
Different metrics serve different purposes, and understanding which ones matter most for your business objectives is essential. Here are the essential categories:
- Traffic metrics: Sessions, users, page views, and new versus returning visitors
- Engagement metrics: Bounce rate, pages per session, average session duration
- Acquisition metrics: Traffic sources, referral paths, campaign performance
- Conversion metrics: Goal completions, e-commerce transactions, form submissions
- Technical metrics: Page load time, server response time, mobile responsiveness
Traffic volume alone tells an incomplete story. A website receiving 10,000 monthly visitors with a 90% bounce rate performs worse than one attracting 2,000 engaged visitors who explore multiple pages and complete actions. This is why modern web analytics requires examining metrics in combination rather than isolation.

Understanding Traffic Sources and Attribution
Where your visitors originate provides critical context for marketing strategy and budget allocation. Google web metrics typically categorise traffic into distinct channels, each requiring different approaches for optimisation.
Breaking Down Channel Performance
Traffic Source | Typical Behaviour | Key Metrics to Watch |
|---|---|---|
Organic Search | High intent, varied engagement | Rankings, click-through rate, conversion rate |
Direct Traffic | Brand-aware, often returning | Session depth, loyalty metrics, conversion rate |
Social Media | Discovery-focused, lower initial intent | Engagement rate, assisted conversions |
Paid Search | Highest intent, conversion-focused | Cost per acquisition, return on ad spend |
Referral | Contextual interest, moderate intent | Referrer quality, engagement depth |
Attribution becomes complex when users interact with multiple touchpoints before converting. A visitor might discover your brand through social media, research via organic search, and finally convert through direct traffic. Understanding these pathways helps allocate resources effectively rather than crediting only the final interaction.
Modern attribution models recognise that customer journeys rarely follow linear paths. The first-click model credits initial discovery, while last-click focuses on final conversion touchpoints. Multi-touch attribution attempts to distribute credit across the entire journey, though implementation complexity increases significantly.
Engagement Metrics That Reveal User Intent
Beyond simple visit counts, engagement metrics reveal whether your content resonates with your audience. These measurements indicate content quality, site usability, and alignment between visitor expectations and what you deliver.
Bounce rate, often misunderstood, measures the percentage of single-page sessions where users leave without interaction. A high bounce rate isn’t inherently negative-a contact page where users find your phone number and call directly might have a 70% bounce rate yet perfectly serve its purpose. Context matters enormously when interpreting Google web metrics.
Time-Based Engagement Signals
Session duration and time on page provide insights into content consumption patterns. However, these metrics come with limitations. A user who opens your article, reads thoroughly for five minutes, then closes the tab appears identical to someone who opened the page and walked away from their computer. This is where event tracking becomes valuable, measuring scrolls, clicks, video plays, and other active interactions.
- Pages per session indicating content discovery success
- Return visitor rate showing brand loyalty development
- Session depth revealing site architecture effectiveness
- Event completion tracking specific user actions
- Exit page analysis identifying content improvement opportunities
European businesses often discover that traditional analytics tools capture more data than necessary whilst simultaneously missing important engagement signals. The challenge lies in finding meaningful measurements without drowning in irrelevant data points or compromising visitor privacy.
Conversion Tracking and Goal Measurement
The ultimate purpose of most websites extends beyond information delivery-whether generating leads, processing transactions, or building email lists. Conversion tracking transforms abstract visitor numbers into concrete business outcomes.
Setting up proper goal tracking requires clearly defining what constitutes a conversion for your business. An e-commerce site might track purchases, whilst a service provider focuses on contact form submissions or phone calls. Multiple goal types can coexist, each assigned different values reflecting their business impact.
Creating Effective Conversion Funnels
Understanding where users abandon their journey toward conversion enables targeted improvements. A checkout process losing 60% of users at the payment stage signals different issues than one where users leave whilst browsing products.
- Map the ideal user journey from landing to conversion
- Identify critical transition points where users must take action
- Measure drop-off rates at each stage
- Analyse user behaviour patterns at abandonment points
- Test solutions systematically and measure impact
Micro-conversions-smaller actions indicating progress toward primary goals-deserve attention alongside main conversions. Newsletter signups, account creations, and product wishlisting all demonstrate growing user investment even if immediate purchase doesn’t occur.

Technical Performance Metrics and User Experience
Page speed and technical performance directly impact both user satisfaction and search rankings. Google web metrics increasingly emphasise Core Web Vitals-loading performance, interactivity, and visual stability-as critical success factors.
Research consistently demonstrates that slow-loading pages drive users away. A delay of just two seconds can increase bounce rates by over 100%, whilst conversion rates drop proportionally with loading time. These effects compound on mobile devices where network conditions vary more dramatically. Tools like the site speed test help identify performance bottlenecks from European server locations, ensuring measurements reflect your actual audience experience.
Core Web Vitals Explained
Metric | Measures | Good Performance |
|---|---|---|
Largest Contentful Paint (LCP) | Loading speed of main content | Under 2.5 seconds |
First Input Delay (FID) | Interactivity and responsiveness | Under 100 milliseconds |
Cumulative Layout Shift (CLS) | Visual stability during loading | Under 0.1 |
These technical measurements connect directly to business outcomes. Improving LCP from 4 seconds to 2 seconds doesn’t simply make your site faster-it measurably increases engagement, reduces abandonment, and improves conversion rates across all traffic sources.
Mobile versus desktop performance often diverges significantly. Your desktop site might load beautifully whilst the mobile version struggles with oversized images, render-blocking scripts, or excessive third-party tracking code. Segmenting technical metrics by device type reveals these disparities.
Privacy-First Analytics in the European Context
The relationship between thorough measurement and visitor privacy has fundamentally shifted for European businesses. Cookie consent requirements, data transfer restrictions, and growing privacy awareness demand new approaches to web analytics.
Traditional analytics tools often rely on extensive cookie tracking, creating friction through consent banners whilst potentially exposing businesses to compliance risks. Many European website owners discover that 40-60% of visitors reject tracking cookies, creating blind spots in their data and skewing measurements toward consent-accepting segments.
The Cookieless Tracking Revolution
Modern analytics platforms have developed cookieless methodologies that provide essential Google web metrics without requiring consent banners or storing personal data. These approaches typically use:
- Server-side tracking that processes data without browser storage
- Privacy-preserving identifiers that cannot track across websites
- Aggregated measurements that eliminate individual user identification
- EU-hosted infrastructure ensuring data never leaves European jurisdiction
EuroMetrics represents this new generation of analytics, designed specifically for European businesses requiring complete visibility without compromising visitor privacy. With 100% EU hosting across Paris, Frankfurt, and Amsterdam data centres, it delivers real-time insights without cookie consent banners or US subprocessors.
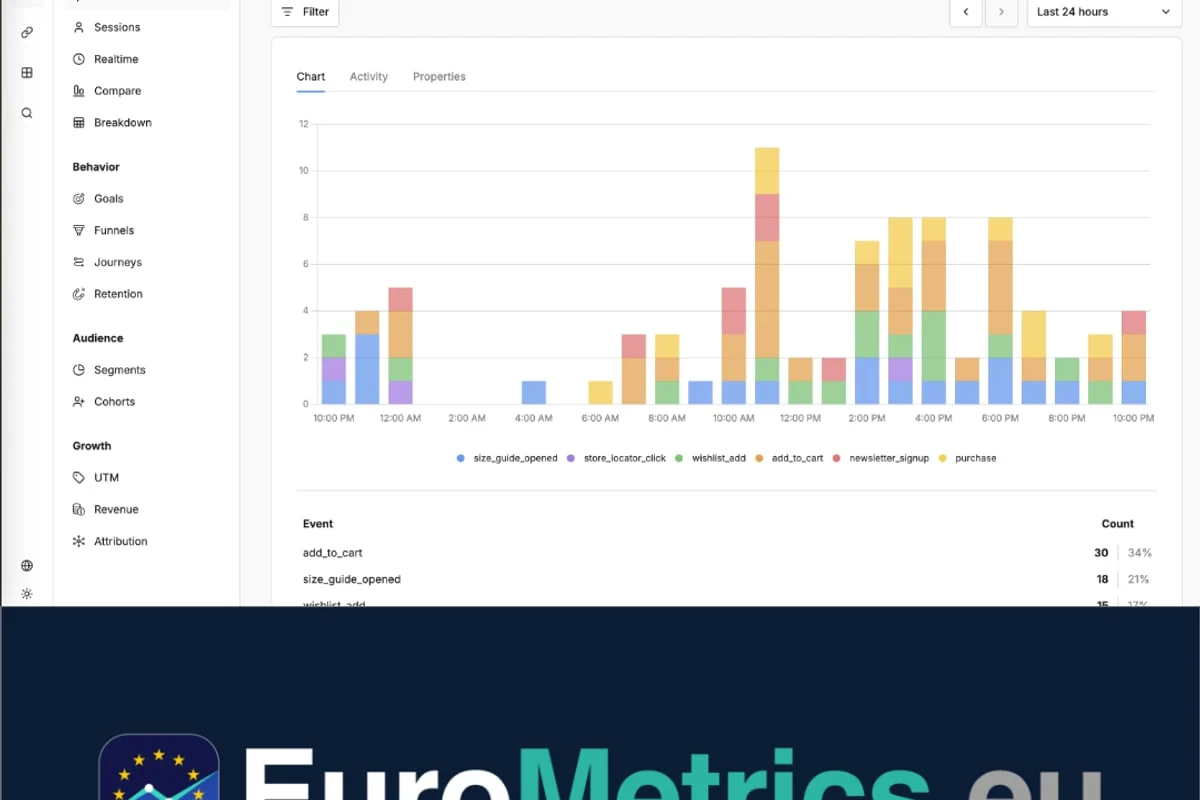
The shift toward cookieless tracking doesn’t mean sacrificing data quality. Purpose-built platforms deliver the core metrics businesses actually need-traffic sources, page performance, conversion tracking-whilst eliminating the complexity and compliance concerns of legacy analytics platforms.
Interpreting Data for Actionable Insights
Collecting Google web metrics serves little purpose without translating measurements into concrete improvements. The gap between data availability and actionable insight creation often determines whether analytics investments deliver returns.
Start by establishing baseline measurements for your key performance indicators. Without understanding current performance, you cannot measure improvement or identify declining trends. Document these baselines monthly rather than seeking perfect precision-directional accuracy matters more than decimal-point precision.
From Numbers to Strategy
Effective data interpretation requires asking the right questions of your metrics:
- Why did traffic increase from social media last month? Identify successful content types or posting schedules to replicate
- Which landing pages convert visitors most effectively? Apply successful elements to underperforming pages
- Where do users abandon the checkout process? Remove friction points systematically
- What content keeps visitors engaged longest? Develop more content around these topics
- Which traffic sources deliver highest-value customers? Adjust marketing budgets accordingly
Correlation doesn’t equal causation in web analytics. Traffic increasing alongside a new blog series might reflect the content quality, seasonal trends, or algorithm changes. Testing hypotheses through controlled experiments provides more reliable insights than assuming cause-and-effect relationships.

Avoiding Common Measurement Mistakes
Even experienced marketers fall into traps when working with Google web metrics. Understanding these pitfalls helps ensure your analytics actually inform rather than mislead decision-making.
Vanity metrics provide ego satisfaction without business value. Total page views sound impressive but mean little without engagement context. A blog post receiving 50,000 views with 95% bounce rate underperforms one attracting 5,000 engaged readers who explore related content and subscribe to your newsletter.
Data Quality Issues to Watch For
Tracking implementation errors corrupt data silently. Common problems include:
- Bot traffic inflating visitor counts without representing real humans
- Internal traffic from employees distorting behaviour patterns
- Referral spam creating fake traffic sources in reports
- Duplicate tracking counting single visits multiple times
- Outdated event triggers measuring discontinued actions
Regular data audits catch these issues before they influence major decisions. Cross-reference analytics data with other business metrics-if reported conversion numbers don’t match actual form submissions or sales, investigate immediately.
Comparing metrics across different time periods requires consistent measurement methodology. Platform changes, tracking updates, or market seasonality can create apparent trends that don’t reflect genuine performance shifts. Year-over-year comparisons often prove more valuable than month-over-month for this reason.
Building Authority Through Performance
Understanding Google web metrics connects directly to search engine performance and domain authority. Website authority reflects how search engines evaluate your site’s trustworthiness and relevance, influenced heavily by user engagement signals.
Google’s algorithms increasingly emphasise user experience metrics when determining rankings. Sites that load quickly, engage visitors effectively, and satisfy search intent consistently outrank competitors with identical keyword targeting but poorer user metrics. According to Search Engine Journal, focusing on genuine user value matters more than optimising for third-party metrics.
The E-E-A-T framework-Experience, Expertise, Authoritativeness, Trustworthiness-demonstrates how search engines evaluate content quality. Strong web metrics support these signals by demonstrating that users find your content valuable enough to engage deeply and return repeatedly.
Alternative Approaches to Web Measurement
The dominance of certain platforms has created a false impression that only one approach to web analytics exists. European businesses have multiple options, each with distinct trade-offs regarding features, complexity, and privacy alignment.
Self-hosted analytics platforms provide maximum control and data ownership but require technical expertise for setup and maintenance. Cloud-hosted alternatives simplify implementation whilst requiring trust in the provider’s data handling practices. The key distinction for European businesses lies in data location and processing-whether information stays within EU jurisdiction or transfers globally.
Evaluating Analytics Platforms
When comparing analytics solutions, consider these factors:
- Data hosting location and legal jurisdiction
- Cookie dependency and consent requirements
- Learning curve and interface complexity
- Real-time versus delayed reporting
- Custom event tracking capabilities
- Export and integration options
- Support availability and documentation quality
- Pricing structure and scalability
Many website owners discover that simpler platforms deliver better results than feature-rich alternatives. A dashboard showing yesterday’s traffic breakdown provides less strategic value than real-time insights enabling immediate response to emerging trends or technical issues. For detailed documentation on cookieless tracking approaches, the EuroMetrics docs explain implementation without technical jargon.
Regulatory Compliance and Data Governance
European data protection regulations have transformed web analytics from a purely technical concern into a legal and ethical consideration. Understanding compliance requirements helps avoid penalties whilst building visitor trust.
The key principle underlying European privacy law is data minimisation-collect only information genuinely necessary for stated purposes. Traditional analytics tools often gather extensive personal data as default behaviour, creating compliance burdens even for basic traffic measurement. Built with GDPR principles in mind, modern cookieless platforms align naturally with regulatory requirements by design rather than requiring complex configuration.
Practical Compliance Steps
Achieving regulatory alignment requires more than selecting the right tools:
- Document your data processing purposes and legal basis clearly
- Update privacy policies to accurately reflect actual tracking practices
- Implement data retention limits rather than storing information indefinitely
- Enable easy data access for visitors requesting their information
- Audit third-party scripts that might process data beyond your control
- Maintain processing records demonstrating compliance efforts
The cookie scanner helps identify exactly what tracking elements your website deploys, including third-party scripts you might not have explicitly authorised. Understanding your complete tracking footprint forms the foundation for meaningful compliance rather than box-ticking exercises.
Frequently Asked Questions
What are the most important Google web metrics to track?
Focus on metrics aligned with business objectives rather than tracking everything available. Essential measurements include traffic sources (understanding visitor origin), conversion rates (measuring goal completion), engagement metrics (session duration and pages per session), and technical performance (page load speed). For e-commerce sites, transaction value and cart abandonment rate prove critical, whilst content sites prioritise return visitor rate and content engagement depth.
How can I track website performance without cookies?
Cookieless tracking uses server-side processing and privacy-preserving identifiers instead of browser cookies. Modern analytics platforms calculate sessions using request patterns, IP addresses (anonymised), and browser fingerprinting that doesn’t persist across sites. This approach delivers core Google web metrics-traffic volume, sources, page views, conversions-without requiring consent banners or storing personal data in visitor browsers. The methodology complies with European privacy requirements whilst maintaining measurement accuracy for business decision-making.
Why do my analytics show different numbers than my server logs?
Discrepancies between analytics platforms and server logs arise from different measurement methodologies. Server logs record every request including bots, scrapers, and prefetch requests, whilst analytics platforms filter non-human traffic. Additionally, users with JavaScript disabled won’t trigger client-side analytics but still appear in server logs. Ad blockers and privacy tools prevent analytics scripts from loading whilst server requests proceed normally. Typically, server logs show 20-40% higher numbers, with the analytics platform providing more accurate human visitor counts.
How often should I review my website metrics?
Review frequency depends on traffic volume and business pace. High-traffic sites benefit from daily monitoring to catch technical issues or traffic anomalies quickly. Medium-traffic sites typically review weekly for trend identification, with monthly deep analysis for strategic planning. Low-traffic sites may find weekly reviews sufficient, though monthly remains minimum for maintaining awareness. Set up automated alerts for significant changes-traffic drops over 30%, conversion rate changes, or technical performance degradation-enabling immediate response regardless of review schedule.
Can website analytics help improve search engine rankings?
Web metrics inform SEO strategy through multiple pathways. User engagement signals-time on page, bounce rate, pages per session-indicate content quality that search algorithms reward. Technical performance metrics identify speed issues that directly impact rankings. Traffic source analysis reveals which content attracts organic search visitors, guiding content development priorities. Conversion tracking demonstrates which pages satisfy user intent most effectively, worth prioritising in internal linking strategies. According to Wikipedia’s overview, various SEO metrics work together to evaluate search performance, though understanding authoritative linking matters more than individual metric optimisation.
What makes a web analytics platform suitable for European businesses?
European businesses require analytics platforms offering data sovereignty-hosting exclusively within EU data centres without transferring information to other jurisdictions. Cookieless tracking eliminates consent banner friction whilst maintaining compliance with privacy regulations. Transparent data handling without hidden subprocessors or third-party sharing builds visitor trust. Real-time reporting enables immediate decision-making rather than delayed data processing. Simple interfaces reduce training requirements and ongoing complexity compared to enterprise platforms designed for large corporations with dedicated analytics teams.
Understanding and using Google web metrics matters more than ever for European businesses trying to balance detailed insights with privacy compliance. The tools and approaches you choose directly impact both your data quality and visitor trust, making platform selection a strategic decision rather than a technical detail. If you’re seeking cookieless analytics with 100% EU hosting and real-time dashboards, explore how EuroMetrics delivers the measurements you need without the complexity you don’t.