
Understanding how visitors interact with your website is no longer optional. Modern businesses must grasp user behaviour patterns, identify friction points, and optimise digital experiences based on evidence rather than assumptions. UX analytics provides this foundation, combining quantitative data with qualitative insights to reveal exactly how users navigate your digital properties. For European businesses particularly, implementing UX analytics requires balancing thorough tracking with strong privacy protections, making tool selection and methodology critical to success.
What UX Analytics Actually Measures
UX analytics encompasses the systematic collection and analysis of user interaction data to improve digital experiences. Unlike basic web metrics that simply count visits, UX analytics examines how users engage with interface elements, where they encounter difficulties, and which pathways lead to conversions.
The discipline bridges quantitative measurement with qualitative understanding. Numbers reveal what happens, whilst context explains why. This dual approach transforms raw data into actionable design decisions.
Core Metrics That Matter
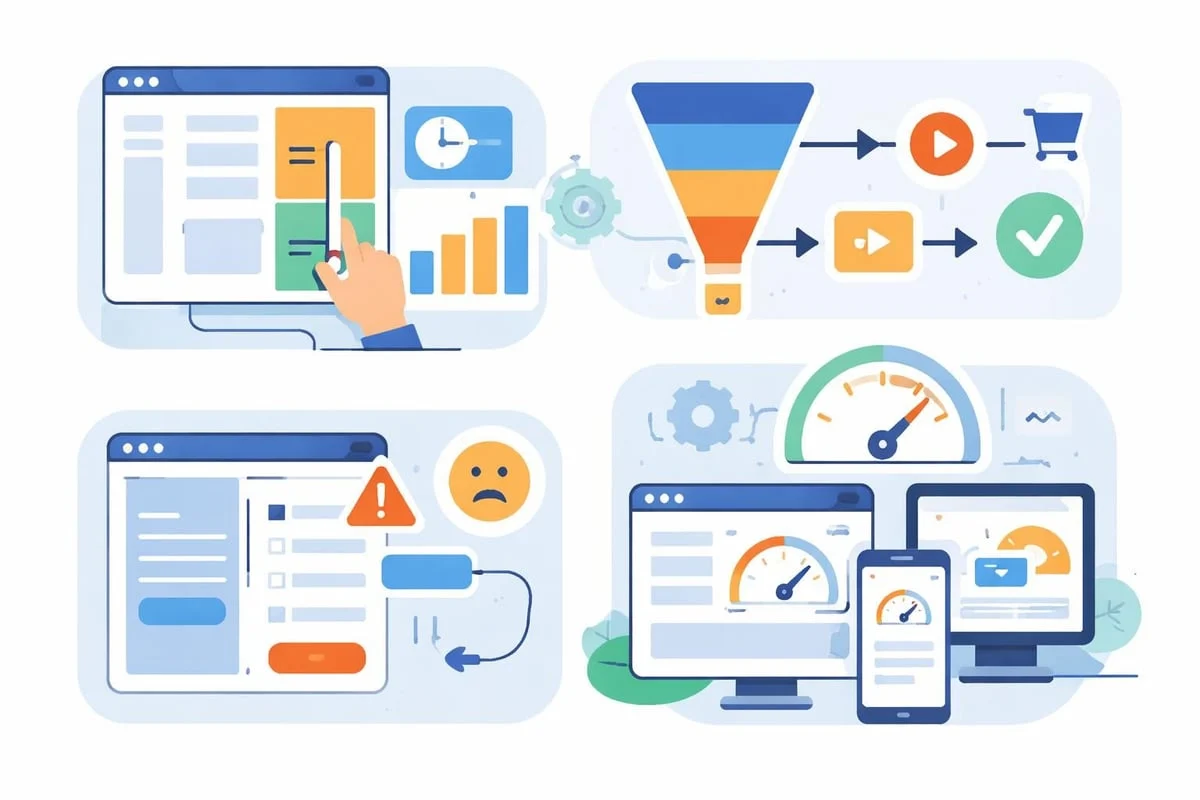
Effective UX analytics tracks several fundamental measurements:
- Engagement depth: Time spent on key pages, scroll depth, and interaction rates with critical elements
- Conversion pathways: User journeys from entry to goal completion, including drop-off points
- Error indicators: Form abandonment rates, 404 encounters, and failed search queries
- Performance impact: How load times and technical issues affect user behaviour
- Device and context: How experience varies across desktop, mobile, and tablet users
These metrics should align with specific business objectives rather than vanity numbers. A publishing site prioritises reading time and content consumption, whilst an e-commerce platform focuses on checkout completion and product discovery patterns.
Quantitative Methods for User Behaviour Analysis
Web analytics platforms form the backbone of quantitative UX analytics. These tools capture every click, scroll, and navigation event, creating detailed datasets about user behaviour patterns.
Event tracking proves particularly valuable for understanding specific interactions. Rather than simply knowing someone visited your pricing page, event tracking reveals which pricing tier they explored, whether they compared options, and what triggered their exit.
Session recordings provide another quantitative lens. By capturing actual user journeys, these recordings expose usability problems that aggregate data might miss. The European best practices for analytics implementation emphasise transparent tracking that respects user privacy whilst maintaining analytical rigour.
Method | Data Type | Best Use Case | Privacy Consideration |
|---|---|---|---|
Page analytics | Aggregate visits, sources | Traffic patterns, content performance | Minimal with cookieless tracking |
Event tracking | Specific interactions | Feature usage, button clicks | Requires clear user information |
Heatmaps | Click and scroll patterns | Page layout optimisation | Anonymise individual sessions |
Session replay | Complete user journeys | Troubleshooting UX problems | Must exclude sensitive form data |
Cookieless tracking has emerged as essential for European businesses. Traditional analytics tools rely heavily on third-party cookies, creating consent requirements and data transfer concerns. Modern platforms built with privacy principles at their core eliminate these complications whilst maintaining analytical depth.
Setting Up Effective Event Tracking
Implementing meaningful event tracking requires strategic planning. Begin by identifying the five to ten most critical user actions on your site. For a SaaS platform, this might include trial sign-ups, feature activations, and upgrade clicks.
Structure your events with consistent naming conventions. Use a hierarchical format like category_action_label to maintain organisation as your tracking expands. Document every event meticulously so team members understand what each measurement represents.
Test thoroughly before deploying to production. Send test events and verify they appear correctly in your analytics dashboard. The technical implementation guidance from UX research experts emphasises validation as non-negotiable for data accuracy.
Qualitative Insights That Complete the Picture
Numbers reveal patterns, but qualitative research explains motivations. Combining quantitative UX analytics with qualitative methods gives a fuller understanding of user experience.
User interviews provide direct insight into pain points and expectations. Select participants representing your core audience segments, then ask open-ended questions about their experience. Record sessions for later analysis, noting emotional responses alongside verbal feedback.
Usability testing observes real users attempting realistic tasks. Watch where they hesitate, what confuses them, and which elements they overlook entirely. These sessions often expose assumptions your team made during design that don’t align with actual user mental models.
Survey Integration Points
Strategic survey placement captures feedback at key moments:
- Post-purchase surveys: Understand what convinced users to convert
- Exit surveys: Learn why visitors leave without completing goals
- Feature-specific feedback: Gather reactions to new implementations
- Periodic satisfaction checks: Track experience quality over time
Keep surveys brief and focused. Each additional question reduces completion rates, so prioritise the most valuable insights. The data collected through surveys enriches quantitative findings by adding the “why” behind behavioural patterns.
Privacy-Conscious Analytics for European Markets
European businesses face unique requirements when implementing UX analytics. Data protection regulations demand careful consideration of what you track, how you store it, and where processing occurs.
Cookieless tracking eliminates the most common compliance hurdle. Without setting cookies, you avoid triggering consent requirements that interrupt user experience with intrusive banners. Modern analytics approaches use server-side tracking and privacy-preserving identifiers to maintain analytical capability whilst respecting user privacy.
Data sovereignty matters for both compliance and user trust. Hosting analytics infrastructure within the EU ensures data never leaves European jurisdiction. This approach aligns with regional data transfer restrictions whilst demonstrating commitment to digital sovereignty principles.
For European SMBs seeking reliable analytics without privacy complications, platforms built specifically for the European market offer distinct advantages. EuroMetrics provides full tracking through 100% EU-hosted infrastructure in Paris, Frankfurt, and Amsterdam, using cookieless methods that eliminate consent banner requirements entirely.

Building Trust Through Transparency
Users increasingly value privacy, making transparency a competitive advantage. Clearly communicate what data you collect, why you need it, and how you protect it. Provide accessible privacy documentation that explains your analytics practices in plain language.
Implement data minimisation principles. Collect only what serves specific analytical purposes, avoiding the “track everything” approach common with legacy platforms. Regular data audits ensure you’re not accumulating unnecessary information that increases both risk and storage costs.
Turning Analytics Into Action
Data collection serves no purpose without analysis and implementation. Establishing regular review processes ensures UX analytics actually improves user experience rather than simply accumulating in dashboards.
Weekly metrics reviews keep teams aligned on performance. Focus these sessions on changes and anomalies rather than reciting static numbers. When bounce rates spike on a key landing page, investigate immediately to identify and resolve the cause.
Monthly deep dives explore broader patterns and opportunities. Analyse user journey changes, segment performance variations, and emerging behaviour trends. These sessions should produce concrete improvement hypotheses for testing.
Prioritising UX Improvements
Not every analytical insight warrants immediate action. Apply a framework for prioritisation:
- Impact potential: How many users does this affect?
- Severity level: How significantly does it harm experience or conversions?
- Implementation effort: What resources does fixing it require?
- Strategic alignment: Does this support broader business objectives?
Plot opportunities on an impact-effort matrix. Quick wins (high impact, low effort) provide immediate value, whilst strategic projects (high impact, high effort) require more planning but deliver substantial returns.
Advanced Techniques for Deeper Understanding
Funnel analysis reveals exactly where users abandon multi-step processes. Map every stage of critical journeys, then calculate drop-off rates between steps. The largest drops indicate your most urgent optimisation opportunities.
Cohort analysis groups users by shared characteristics or acquisition timing, enabling comparison of how different segments behave. Users who joined during a promotional campaign might exhibit different engagement patterns than organic sign-ups, informing both marketing and product decisions.
Segment comparison uncovers experience variations across user groups. Compare mobile versus desktop behaviour, new versus returning visitors, or different traffic sources. These insights often reveal that a single approach doesn’t serve all audiences equally well.
Attribution and Content Performance
Understanding which content drives conversions requires proper attribution modelling. First-touch attribution credits the initial contact point, whilst last-touch credits the final interaction before conversion. Multi-touch models distribute credit across the journey, providing nuanced understanding of how content works together.
For businesses creating content strategies, analysing inbound link data alongside user behaviour reveals which topics attract both links and engaged visitors. This combination signals genuine authority that search engines reward.
Technical Implementation Considerations
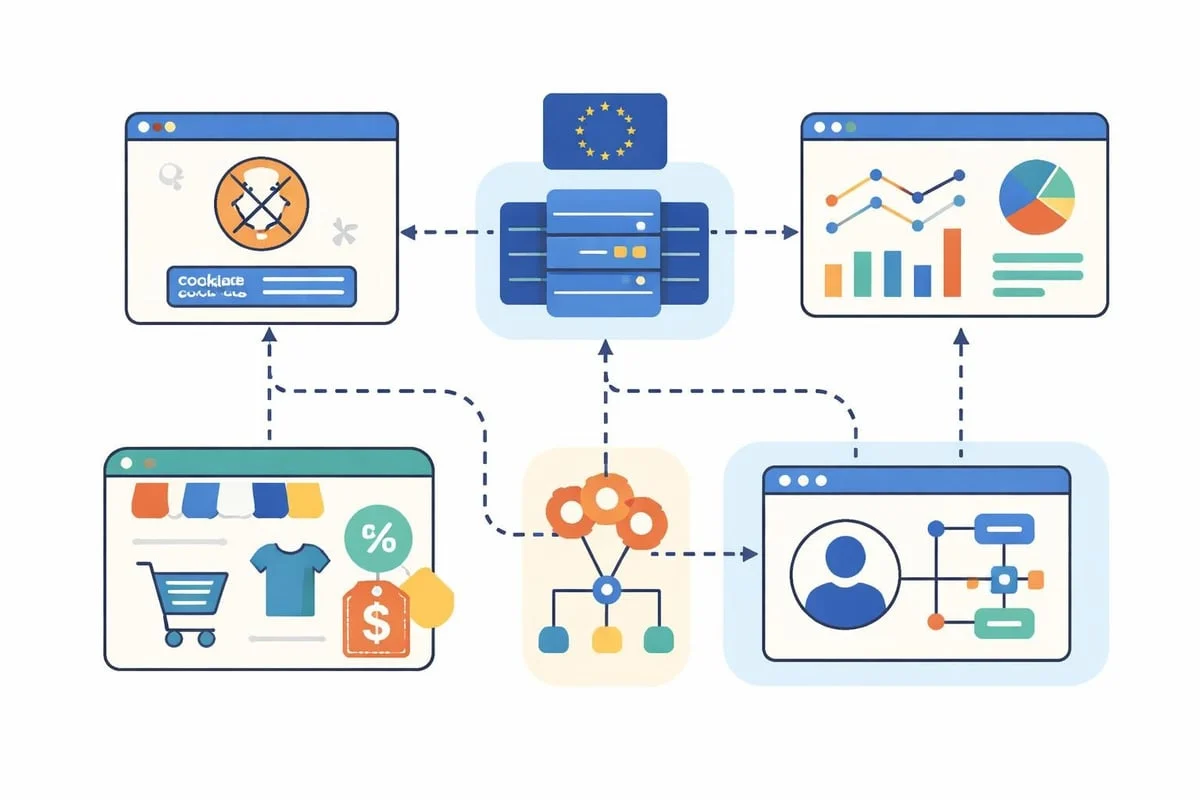
Choosing analytics tools requires evaluating both capabilities and architecture. European businesses should prioritise platforms offering EU-hosted infrastructure, transparent data handling, and cookieless tracking capabilities. These technical foundations prevent compliance complications whilst maintaining analytical depth.
Implementation speed affects data quality. The faster your analytics script loads and executes, the more accurate your measurements become. Users who leave quickly might not trigger slow-loading trackers, creating blind spots in your data. Testing your implementation through tools like a speed test service ensures tracking doesn’t compromise performance.
Integration with existing systems amplifies analytical value. Connecting UX analytics with your CRM reveals how website behaviour correlates with customer lifetime value. E-commerce integrations link browsing patterns to purchase data, enabling sophisticated product recommendation optimisation.
Ensuring Data Accuracy
Regular validation prevents analytical drift. Implement these accuracy checks:
- Cross-reference with server logs: Verify analytics numbers align with actual server traffic
- Test conversion tracking: Complete goal actions yourself and confirm they register correctly
- Monitor data anomalies: Set alerts for unusual spikes or drops that indicate tracking issues
- Audit filter configurations: Ensure you’re not accidentally excluding legitimate traffic
Documentation supports long-term data integrity. When team members change tracking configurations, require notation of what changed, when, and why. This historical record proves invaluable when interpreting long-term trends or investigating unexpected pattern shifts.
Organisational Integration of UX Analytics
Analytics insights only create value when they inform decisions across your organisation. Democratising access to data empowers team members whilst standardising interpretation prevents misuse.
Create role-specific dashboards that surface relevant metrics for different functions. Marketing teams need traffic sources and campaign performance, whilst product teams require feature usage and engagement depth. Custom views reduce cognitive load and focus attention appropriately.
Training ensures accurate interpretation. Schedule regular sessions covering both tool usage and analytical thinking. Help team members distinguish correlation from causation, recognise statistical significance, and frame insights as testable hypotheses rather than absolute truths.
Establishing Analytics Governance
As organisations mature their UX analytics practice, governance becomes essential. Define who can modify tracking implementations, how new metrics get approved, and what documentation standards apply.
Create a data dictionary cataloguing every metric, dimension, and segment your organisation uses. This shared reference prevents confusion when terms have multiple interpretations and accelerates onboarding for new team members.
Measuring UX Analytics Success
How do you know if your UX analytics practice is actually working? Meta-metrics evaluate the analytics programme itself rather than website performance.
Time to insight measures how quickly you can answer critical business questions. If extracting needed data requires extensive manual work, your analytics architecture needs refinement. Mature practices answer most questions through existing dashboards within minutes.
Implementation accuracy tracks what percentage of planned tracking actually works correctly. Regular audits should reveal few gaps between intended and actual measurement capability.
Decision impact assesses how frequently analytics insights drive actual changes. If analyses sit unread or recommendations remain unimplemented, investigate why. Perhaps insights lack clarity, recommendations seem impractical, or organisational culture doesn’t prioritise data-informed decisions.
Success Indicator | Target Threshold | Measurement Method |
|---|---|---|
Time to insight | Under 10 minutes for standard questions | Track query completion time |
Implementation accuracy | Above 95% of events functioning | Quarterly tracking audit |
Decision impact | Analytics influences 60%+ of UX changes | Tag implemented changes with data source |
Team adoption | 80%+ of relevant staff access dashboards monthly | Platform usage logs |
Continuous Improvement Cycles
UX analytics excellence requires ongoing refinement. Quarterly reviews of your analytics programme identify gaps, redundancies, and emerging needs. As your business evolves, tracking requirements change alongside it.
Benchmark against industry standards whilst recognising your unique context. Average session duration for a news site differs dramatically from a SaaS application. Industry comparisons provide context, but internal trends matter more than external averages.
Stay current with analytical methodologies and privacy developments. The field shifts constantly, with new measurement approaches emerging whilst regulatory requirements evolve. Resources like the UXAX insights library help practitioners maintain current knowledge and discover innovative techniques.
FAQ
What’s the difference between web analytics and UX analytics?
Web analytics focuses primarily on traffic metrics like visits, page views, and referral sources. UX analytics goes deeper, examining how users interact with specific interface elements, where they encounter friction, and which design patterns support or hinder goal completion. Whilst web analytics answers “how many people came?”, UX analytics reveals “what did they experience and why did they behave that way?”. Both disciplines overlap significantly, with modern platforms increasingly combining these perspectives into unified insights.
How much data do I need before drawing conclusions?
Statistical significance depends on both sample size and effect size. For major changes affecting many users, you might detect meaningful patterns within days. Subtle improvements or low-traffic segments require longer observation periods to distinguish signal from noise. As a general guideline, wait until you have at least 100-200 conversions per variant when testing changes. More importantly, look for consistent patterns across multiple weeks rather than reacting to single-day fluctuations, which often reflect random variation rather than genuine trends.
Can I implement UX analytics without cookies?
Absolutely. Cookieless analytics has matured significantly, using server-side tracking, privacy-preserving identifiers, and session-based measurement to maintain analytical capability without third-party cookies. These approaches often provide more accurate data than cookie-based methods, which suffer from increasing blocker adoption and cross-device tracking limitations. For European businesses particularly, cookieless implementations eliminate consent banner requirements whilst ensuring data sovereignty through EU-hosted infrastructure. The analytical depth stays intact, covering all essential metrics from user journeys to conversion attribution.
What analytics metrics matter most for e-commerce sites?
E-commerce UX analytics should prioritise conversion funnel performance, tracking users from product discovery through checkout completion. Monitor add-to-cart rates, cart abandonment points, and checkout step completion to identify friction. Product page engagement metrics reveal which content elements support purchase decisions. Category browsing patterns show how effectively your navigation serves different shopping intents. Post-purchase behaviour including repeat visit rates and customer lifetime value complete the picture, connecting immediate UX with long-term business value.
How do I convince stakeholders to invest in better analytics?
Frame analytics capabilities as directly connected to business outcomes rather than technical features. Calculate the value of a single percentage point improvement in conversion rates, then demonstrate how better insights enable such improvements. Present specific examples where current analytical gaps prevent answering critical business questions. Show competitors using sophisticated analytics to optimise experiences and gain market advantage. Most compellingly, run a small pilot project demonstrating how enhanced UX analytics quickly identifies and resolves a costly UX problem, proving ROI through concrete results.
Should small businesses invest in UX analytics?
Small businesses often gain disproportionate value from UX analytics because limited resources make efficiency critical. Rather than guessing which improvements matter most, analytics reveals exactly where effort creates maximum impact. Modern platforms designed for SMBs eliminate the complexity and cost barriers that previously made sophisticated analytics enterprise-only territory. Start with fundamental measurements around your most critical conversion paths, then expand as analytical maturity grows. Even basic implementation typically pays for itself quickly by preventing expensive design mistakes and focusing development on features users actually need.
Implementing solid UX analytics transforms how European businesses understand and serve their users, replacing assumptions with evidence whilst maintaining the privacy standards your audience expects. For thorough, privacy-conscious tracking that provides actionable insights without complexity, EuroMetrics delivers cookieless analytics through 100% EU-hosted infrastructure, giving you complete visibility into user behaviour whilst respecting digital sovereignty principles. Start tracking what matters today with a platform built specifically for European businesses navigating modern privacy requirements.