
Understanding which website analytics metrics to track can transform how European businesses make strategic decisions. With data privacy regulations reshaping analytics and cookieless tracking becoming the standard, choosing the right metrics has never mattered more. Modern businesses need actionable insights without compromising visitor privacy or drowning in unnecessary data points. This guide explores the essential website analytics metrics that matter in 2026, helping you focus on measurements that directly impact your bottom line whilst respecting digital sovereignty principles.
Core Traffic Metrics That Define Website Performance
Traffic metrics form the foundation of any web analytics strategy. These measurements reveal how visitors discover and interact with your website, providing essential context for all subsequent analysis.
Visitors and Sessions represent the most fundamental website analytics metrics. Unique visitors show the number of distinct individuals accessing your site, whilst sessions track total visits regardless of repetition. A single visitor might generate multiple sessions over time, making the ratio between these two metrics particularly revealing.
Distinguishing New Versus Returning Visitors
This metric reveals audience loyalty and content effectiveness. High percentages of returning visitors suggest strong engagement and valuable content, whilst new visitor growth indicates successful acquisition strategies.
Key considerations include:
- New visitors typically explore 2-3 pages before leaving
- Returning visitors demonstrate 40-60% higher engagement rates
- Balanced growth in both categories signals healthy expansion
- Sharp increases in new traffic require corresponding retention efforts
The relationship between these segments helps European businesses understand whether their marketing initiatives attract fresh audiences whilst maintaining existing relationships.

Page Views and Pages Per Session
Page views count total pages loaded, whilst pages per session reveals engagement depth. Higher pages per session generally indicate compelling content that encourages exploration, though context matters significantly.
Metric | Industry Average | Excellent Performance | Concerning Level |
|---|---|---|---|
Pages per session | 2.5-3.0 | 4.0+ | Below 1.5 |
Average session duration | 2-3 minutes | 5+ minutes | Under 1 minute |
Bounce rate | 40-60% | Under 30% | Above 70% |
Landing pages with higher pages per session demonstrate effective internal linking and content relevance. However, single-page sessions aren't always negative-a contact page visit that immediately converts represents success despite minimal navigation.
Engagement Metrics That Reveal User Intent
Website analytics metrics measuring engagement go beyond superficial traffic counts to reveal actual user behaviour and content effectiveness.
Bounce rate indicates the percentage of visitors leaving after viewing only one page. Whilst often misinterpreted as purely negative, context determines bounce rate significance. Blog posts naturally generate higher bounce rates as readers find answers and leave satisfied.
Time-Based Engagement Signals
Average session duration and time on page provide useful context for content performance. Longer durations suggest engaging material, though extremely long times might indicate navigation difficulties or confusion.
Engagement patterns vary by content type:
- Blog articles: 3-6 minutes indicates thorough reading
- Product pages: 1-2 minutes suggests consideration
- Landing pages: 30-60 seconds often precedes conversion
- Documentation: 5+ minutes shows active problem-solving
Modern cookieless analytics platforms track these metrics without invasive cookies by using server-side measurements and session-based tracking that respects visitor privacy whilst delivering accurate data.
The campaign URL builder helps European businesses track engagement across different marketing channels, revealing which campaigns generate the most meaningful interactions.
Conversion Metrics That Drive Business Results
Website analytics metrics focused on conversions connect digital activity to tangible business outcomes. These measurements justify marketing expenditure and guide strategic resource allocation.
Goal completion rate tracks the percentage of sessions resulting in desired actions-newsletter signups, purchases, downloads, or contact form submissions. Defining clear, measurable goals transforms analytics from observation to actionable intelligence.
Conversion Rate Optimisation Fundamentals
Conversion rate represents completed goals divided by total sessions, expressed as a percentage. Small improvements in conversion rates create substantial revenue increases without requiring additional traffic acquisition costs.
Consider this practical example:
- 10,000 monthly visitors
- 2% conversion rate = 200 conversions
- 3% conversion rate = 300 conversions
- 50% increase in conversions with identical traffic
European businesses achieve conversion rate improvements through systematic testing of page elements, copy adjustments, and simplified user journeys. Research on web quality demonstrates that perceived performance significantly impacts conversion behaviour.

Micro-Conversions and Progression Metrics
Not every visitor converts immediately. Micro-conversions-newsletter signups, resource downloads, video plays-indicate progression toward primary goals. Tracking these intermediate steps reveals where potential customers engage and where friction occurs.
Conversion Stage | Typical Rate | Optimisation Priority |
|---|---|---|
Landing to engagement | 40-50% | High-first impression critical |
Engagement to consideration | 20-30% | Medium-content quality matters |
Consideration to conversion | 10-15% | High-final objections addressed |
Abandoned cart recovery | 15-20% | Very high-intent already demonstrated |
Traffic Source Attribution and Channel Performance
Understanding which channels drive valuable traffic represents essential website analytics metrics knowledge. Attribution reveals marketing ROI and guides budget allocation across platforms.
Direct traffic arrives through bookmarked URLs or typed addresses, typically indicating brand awareness and returning visitors. Organic search demonstrates content effectiveness and SEO performance, whilst referral traffic shows partnership value and backlink quality.
Evaluating Channel-Specific Performance
Different channels serve distinct purposes in the customer journey. Comparing channel performance requires context-social media might generate awareness with lower immediate conversion rates, whilst email marketing typically produces higher conversion rates from engaged audiences.
Search analytics provides deeper insight into organic search performance, revealing which queries drive traffic and how search engine algorithms interpret content relevance.
Channel performance indicators include:
- Cost per acquisition by channel
- Average order value from different sources
- Customer lifetime value by acquisition channel
- Multi-touch attribution across customer journeys
The authority and relevance of inbound links significantly impacts organic search performance, making referral source quality a critical website analytics metric for European businesses focused on sustainable growth.
Audience Demographics and Geographic Metrics
Website analytics metrics revealing audience characteristics enable precise targeting and content personalisation. Geographic data, device information, and behavioural patterns inform strategic decisions about market expansion and technical optimisation.
Location data shows where visitors originate, helping European businesses identify growth opportunities in specific regions or countries. Device metrics-desktop versus mobile versus tablet-guide responsive design priorities and technical infrastructure decisions.
Browser and Technology Insights
Browser, operating system, and screen resolution data ensure technical compatibility across your audience's preferred platforms. Declining support for outdated browsers becomes data-driven when metrics show negligible usage from those platforms.
Modern cookieless analytics platforms, designed with GDPR principles in mind, collect demographic and geographic data without personally identifiable information or consent banners that degrade user experience.
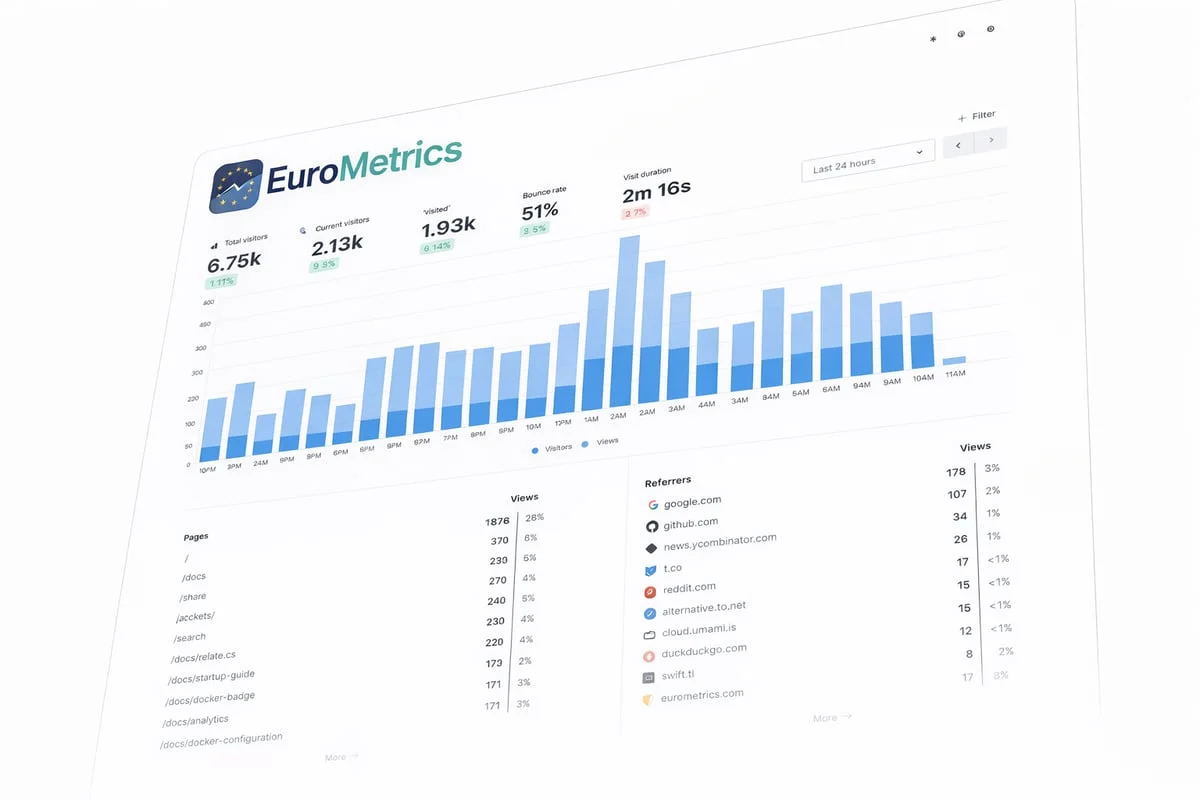
For businesses operating across multiple European markets, the EuroMetrics platform offers 100% EU-hosted analytics with data centres in Paris, Frankfurt, and Amsterdam, ensuring data never leaves European jurisdiction whilst providing detailed audience insights.
Technical Performance Metrics That Impact Experience
Website analytics metrics measuring technical performance directly correlate with engagement and conversion rates. Page load speed, error rates, and availability metrics reveal infrastructure quality and identify optimisation opportunities.
Page load time represents the duration from initial request to fully rendered page. Research consistently demonstrates that pages loading in under two seconds generate significantly higher engagement and conversion rates than slower alternatives.
Core Web Vitals and User Experience
Google's Core Web Vitals-Largest Contentful Paint, First Input Delay, and Cumulative Layout Shift-quantify user experience quality through measurable technical metrics. These measurements influence both search rankings and conversion performance.
Core Web Vital | Good Performance | Needs Improvement | Poor Performance |
|---|---|---|---|
LCP (loading) | Under 2.5s | 2.5-4.0s | Over 4.0s |
FID (interactivity) | Under 100ms | 100-300ms | Over 300ms |
CLS (visual stability) | Under 0.1 | 0.1-0.25 | Over 0.25 |
The speed test tool enables European businesses to measure page performance from EU servers, providing accurate data about how their target audiences experience site loading times.
Error tracking through 404 pages and server errors reveals broken links, missing resources, and infrastructure issues. High error rates correlate with visitor frustration and abandoned sessions.
Content Performance and Engagement Analysis
Website analytics metrics evaluating specific content pieces identify top performers and underperforming pages requiring optimisation. Page-level analysis reveals which topics resonate with audiences and which formats generate engagement.
Top pages by traffic show content discovery effectiveness, whilst top pages by time on page reveal engagement quality. The distinction matters-high traffic with low engagement suggests misleading titles or poor content quality, whilst lower traffic with high engagement indicates valuable content requiring better promotion.
Internal Search and Navigation Patterns
Internal site search queries reveal visitor intent and content gaps. When users search your site, they're explicitly stating what they need-capturing and analysing these queries provides direct audience research.
Navigation path analysis shows how visitors move through your site, identifying common journeys and unexpected routes. This unified analytics framework approach connects individual page metrics into a full picture of user journeys.
Exit pages identify where visitors most frequently leave your site. High exit rates on critical conversion pages signal problems requiring immediate attention, whilst high exits from confirmation pages simply indicate successful completion.
Advanced Metrics for E-commerce and Lead Generation
European businesses engaged in e-commerce or lead generation require specialised website analytics metrics beyond standard traffic measurements. Revenue attribution, average order value, and customer acquisition cost connect analytics directly to financial performance.
Revenue per visitor divides total revenue by total visitors, creating a simple efficiency metric. Average order value reveals purchasing patterns and upsell effectiveness. Cart abandonment rate identifies friction in the checkout process.
Customer Lifetime Value and Retention
Customer lifetime value (CLV) extends beyond individual transactions to measure long-term relationship profitability. Calculating CLV requires integrating website analytics metrics with customer relationship management data, revealing which acquisition channels deliver the most valuable long-term customers.
Lead quality metrics include:
- Marketing qualified leads (MQL) meeting demographic criteria
- Sales qualified leads (SQL) demonstrating purchase intent
- Opportunity conversion rates from SQL to closed deals
- Revenue attribution to specific content or campaigns
For businesses tracking these sophisticated metrics, maintaining data ownership through EU-hosted infrastructure ensures compliance with data protection regulations whilst enabling full cross-platform analysis.
Behavioural Flow and User Journey Mapping
Website analytics metrics revealing user journeys demonstrate how visitors navigate toward conversion or exit. Behavioural flow visualisations identify common paths, unexpected detours, and abandonment points requiring optimisation.
Entry and exit analysis shows where journeys begin and end. Multiple entry points indicate strong content distribution and search visibility, whilst concentrated entry suggests over-reliance on single traffic sources.
Conversion Funnel Optimisation
Funnel visualisation tracks progression through multi-step processes-product selection, basket review, checkout initiation, payment completion. Each stage represents potential abandonment requiring analysis and refinement.
Drop-off rates between funnel stages reveal specific friction points. A 30% drop-off between basket and checkout initiation suggests payment concerns or unexpected costs, whilst abandonment during payment processing might indicate technical issues or insufficient payment options.
Scalable SEO reporting metrics emphasise the importance of tracking user journeys from organic search through conversion, connecting content performance with business outcomes.
Real-Time Monitoring and Alert Systems
Whilst historical analysis drives strategic planning, real-time website analytics metrics enable immediate response to emerging opportunities and urgent problems. Live visitor counts, current conversion rates, and active page views reveal present performance.
Real-time geographic data shows where current visitors originate, enabling time-zone-specific marketing and content scheduling. Active pages reveal which content currently attracts attention, informing social media promotion and paid advertising adjustments.
Performance Anomaly Detection
Automated alerts notify teams when website analytics metrics deviate significantly from expected patterns. Traffic spikes might indicate viral content or technical issues, whilst sudden conversion rate drops signal checkout problems or campaign errors.
The uptime monitor provides 24/7 surveillance from three European locations with quorum-based detection, ensuring businesses know about availability issues before customers encounter problems.
Critical real-time alerts include:
- Site availability and response time degradation
- Conversion rate drops exceeding threshold percentages
- Traffic surges requiring infrastructure scaling
- Error rate increases indicating technical problems
Privacy-Focused Metrics and Cookieless Tracking
The evolution of privacy regulations and browser policies has fundamentally changed how European businesses collect website analytics metrics. Cookieless tracking methods provide accurate data whilst respecting visitor privacy and eliminating consent banner requirements.
Server-side tracking captures data through log file analysis and server requests rather than browser cookies. Session-based measurement groups visitor actions without persistent identifiers, maintaining accuracy whilst ensuring anonymity.
Modern analytics platforms designed with GDPR principles deliver detailed insights without personally identifiable information. This approach eliminates legal complexity whilst maintaining data accuracy through sophisticated aggregation and pattern recognition.
Privacy-focused metrics advantages:
- No consent banners improving conversion rates
- Complete data capture without cookie blockers
- Full GDPR alignment through design principles
- Enhanced visitor trust and brand reputation
Understanding trustworthy information retrieval systems becomes increasingly relevant as businesses balance thorough analytics with privacy protection, ensuring data quality without compromising ethical standards.
Frequently Asked Questions
What are the most important website analytics metrics for small businesses?
Small European businesses should prioritise conversion rate, traffic sources, and engagement metrics like pages per session and bounce rate. These measurements directly connect to business outcomes without requiring complex analysis. Focus on goal completion rates that align with your primary business objectives-whether newsletter signups, contact form submissions, or product purchases. Starting with 5-7 core metrics prevents analysis paralysis whilst building foundational understanding.
How often should I review website analytics metrics?
Daily monitoring of real-time metrics helps identify immediate issues, whilst weekly reviews reveal tactical trends requiring adjustment. Monthly analysis provides strategic perspective for significant decisions about content, marketing, and user experience. Quarterly reviews should assess long-term trends and competitive positioning. The key is establishing consistent review rhythms that match decision-making timeframes-don't analyse daily what you can only change monthly.
Can cookieless analytics provide the same accuracy as traditional tools?
Yes, modern cookieless analytics platforms deliver comparable accuracy through server-side tracking and sophisticated session identification methods. These approaches actually provide more complete data because they bypass cookie blockers and consent banner abandonment that traditional tools face. Server-side measurement captures all visitors rather than only those accepting cookies, often improving data completeness by 15-30% compared to legacy analytics platforms dependent on client-side tracking.
What website analytics metrics indicate SEO performance?
Organic search traffic volume, keyword rankings, pages per session from organic visitors, and conversion rates from search traffic reveal SEO effectiveness. Additionally, monitor branded versus non-branded search traffic ratios, featured snippet acquisitions, and backlink quality metrics. The SEO check tool provides on-page analysis that complements traffic metrics, identifying technical optimisation opportunities that improve organic performance.
How do I calculate ROI from website analytics metrics?
Calculate ROI by connecting revenue or lead value to acquisition costs per channel. Divide total revenue from a channel by total marketing spend for that channel, then subtract one and multiply by 100 for percentage ROI. For lead generation, multiply leads by average conversion rate and customer value, then compare to acquisition costs. Track assisted conversions and multi-touch attribution to understand how different channels contribute throughout the customer journey rather than only crediting final-click sources.
What metrics should trigger immediate action?
Sudden conversion rate drops exceeding 20%, site availability issues, page load time increases beyond acceptable thresholds, and dramatic traffic spikes that might indicate technical problems all require immediate investigation. Sharp increases in error rates, unexpected changes in traffic sources, and anomalous bounce rate patterns also warrant rapid response. Establish baseline ranges for critical metrics and configure automated alerts when measurements fall outside normal parameters, enabling proactive problem resolution.
Mastering website analytics metrics enables data-driven decisions that improve performance, increase conversions, and justify marketing investments. European businesses benefit from privacy-focused analytics that respect visitor rights whilst delivering actionable insights. If you're ready to track the full set of website analytics metrics without cookies, consent banners, or data sovereignty concerns, EuroMetrics provides 100% EU-hosted analytics with real-time dashboards and complete digital sovereignty. Built specifically for European businesses, EuroMetrics delivers the insights you need with the privacy principles your visitors deserve.