What Is a Funnel?
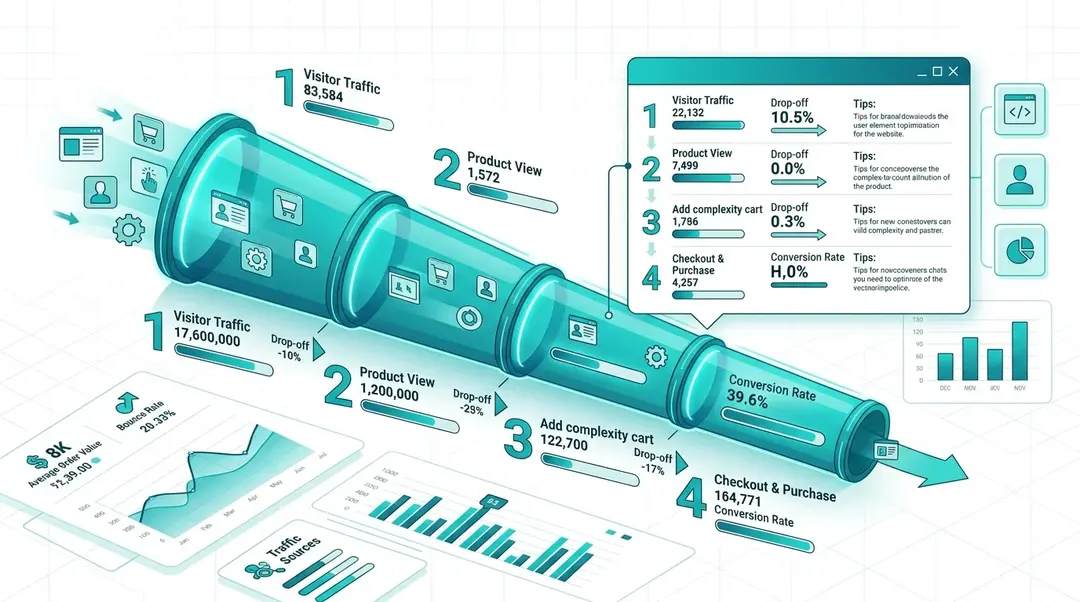
A funnel tracks how visitors move through a sequence of steps, like browsing a product, adding it to the cart, and completing checkout. At each step, some visitors continue and some drop off. Funnels help you see exactly where you’re losing people.
Creating a Funnel
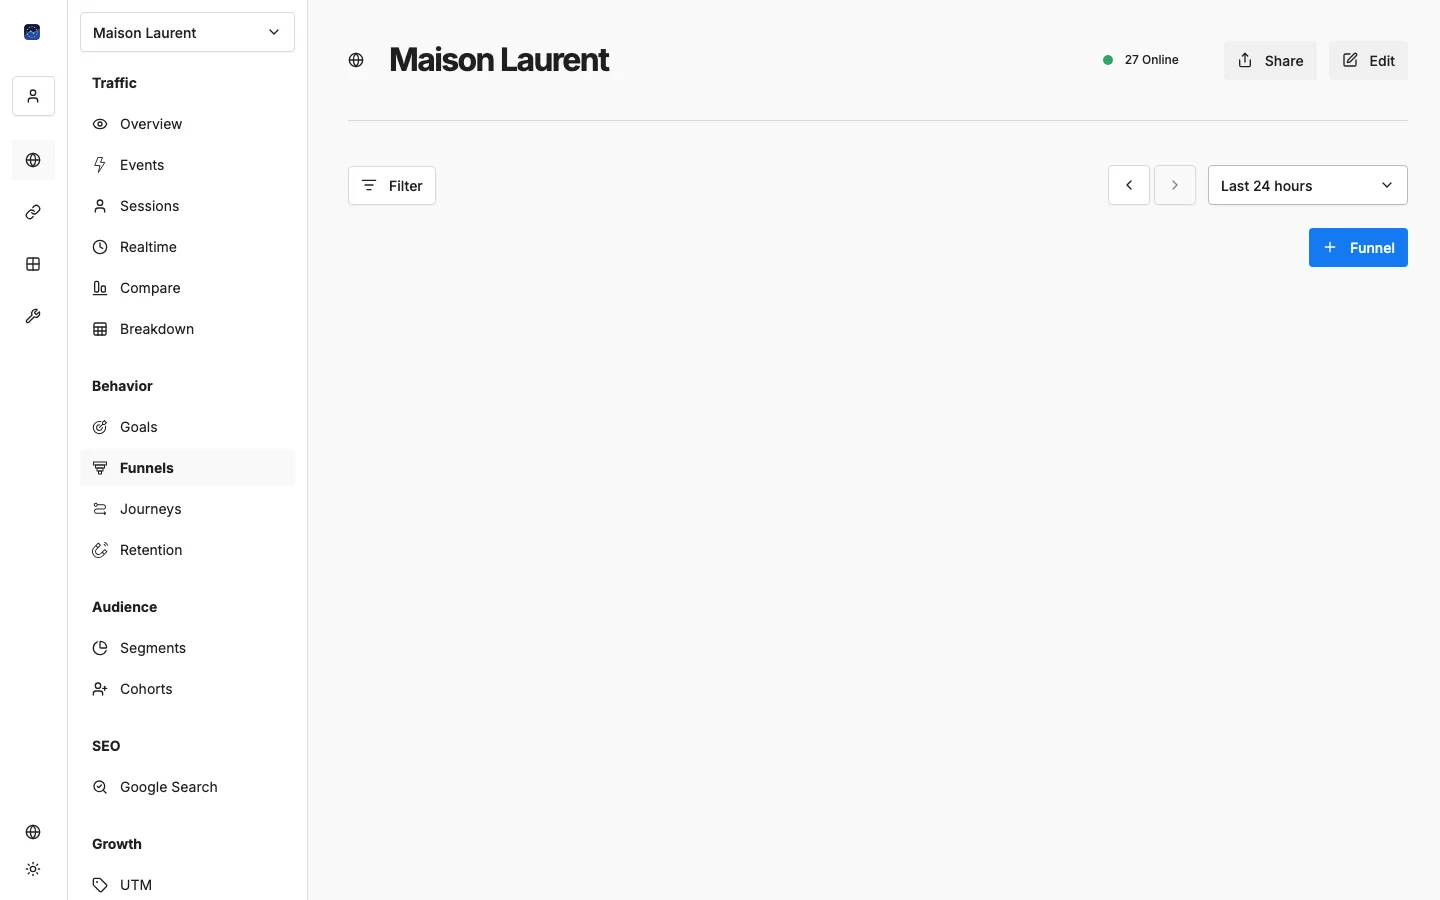
Navigate to your website and click Funnels in the sidebar under Behavior. Then click Create Report.
Configure Your Steps
A funnel needs at least 2 steps and can have up to 8. For each step, choose:
- Type: Page view (a URL path the visitor loads) or Event (a custom event you’re tracking)
- Value: The specific page path (e.g.,
/products) or event name (e.g.,add-to-cart). You can use*as a wildcard.
Set the Time Window
The window defines how long a visitor has to complete the next step. If they take longer, they’re counted as a drop-off.
Enter a number and pick the unit that fits your journey:
- Minutes: short flows such as a checkout (e.g., 30–60 minutes)
- Hours: same-day decisions
- Days: longer research or consideration cycles
For example, a window of 1 hour means a visitor must reach step 2 within 60 minutes of completing step 1.
Unlimited Window
Switch on Unlimited window when steps can be completed across any span of time: a visitor might view a product today and buy a week later. With an unlimited window there is no time cap between steps: a visitor is counted as long as they complete the steps in order within the report’s date range. Use it for long sales cycles, B2B journeys, or any funnel where “eventually” matters more than “quickly.”
Example: E-commerce Checkout Funnel
Step | Type | Value |
|---|---|---|
1 | Page view |
|
2 | Event |
|
3 | Page view |
|
4 | Page view |
|
Reading Funnel Results
Once saved, your funnel shows a visual breakdown:
For each step you’ll see:
- Visitor count: How many people reached this step
- Drop-off: How many visitors (and what percentage) left between the previous step and this one
- Conversion rate: The percentage still remaining, shown as the large figure on the right
- Progress bar: Visual indicator of retention through the funnel
Conversion: From First Step vs From Previous Step
Use the toggle at the top of the funnel to choose how the conversion rate is calculated:
- From first step: Each step is shown as a percentage of the very first step. This is your overall completion rate: “what share of everyone who entered the funnel reached this step.” The first step is always 100%.
- From previous step: Each step is shown as a percentage of the step immediately before it. This isolates step-by-step friction: “of the people who reached the previous step, how many continued.” It’s the fastest way to find the single biggest leak.
The toggle only changes how the numbers are displayed. It doesn’t alter your saved funnel or the underlying data, so you can switch back and forth freely.
Tips for Effective Funnels
- Start broad, then narrow. Your first step should capture a large audience (e.g., homepage or category page). Each subsequent step should be more specific.
- Use wildcards wisely.
/products/*matches any product page, so you don’t need a step for each product. - Match the window to the journey. A checkout funnel works in minutes; a research or B2B funnel may need hours, days, or an unlimited window.
- Use “from previous step” to find leaks. Switch to previous-step conversion to spot the one step where the biggest share of visitors drops off, then focus your fixes there.
- Create multiple funnels. Track different paths: signup flow, checkout flow, content engagement flow.
What’s Next?
Need help? Reach out to us at support@eurometrics.eu.