What Are User Journeys?
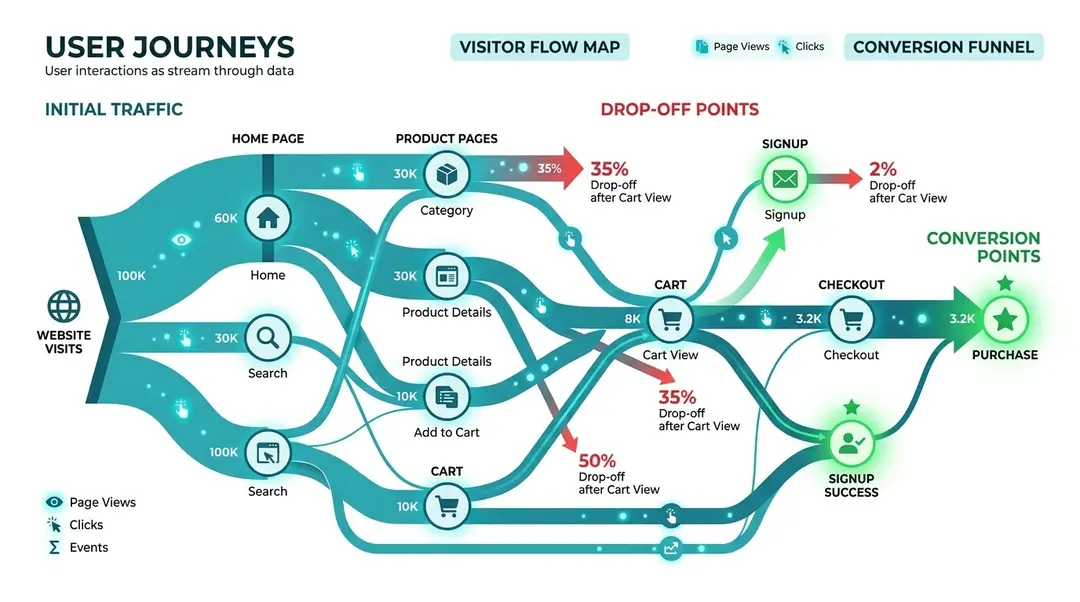
Journeys visualize the paths visitors take through your website, from where they enter to where they leave. Instead of looking at individual pages in isolation, journeys reveal the actual flow: which pages lead to which, where visitors branch off, and where they drop out.
The result is a Sankey diagram: an interactive flow chart where the width of each connection shows how many visitors followed that path.
Creating a Journey Report
Go to Journeys in the sidebar under Behavior, then click Create Report.
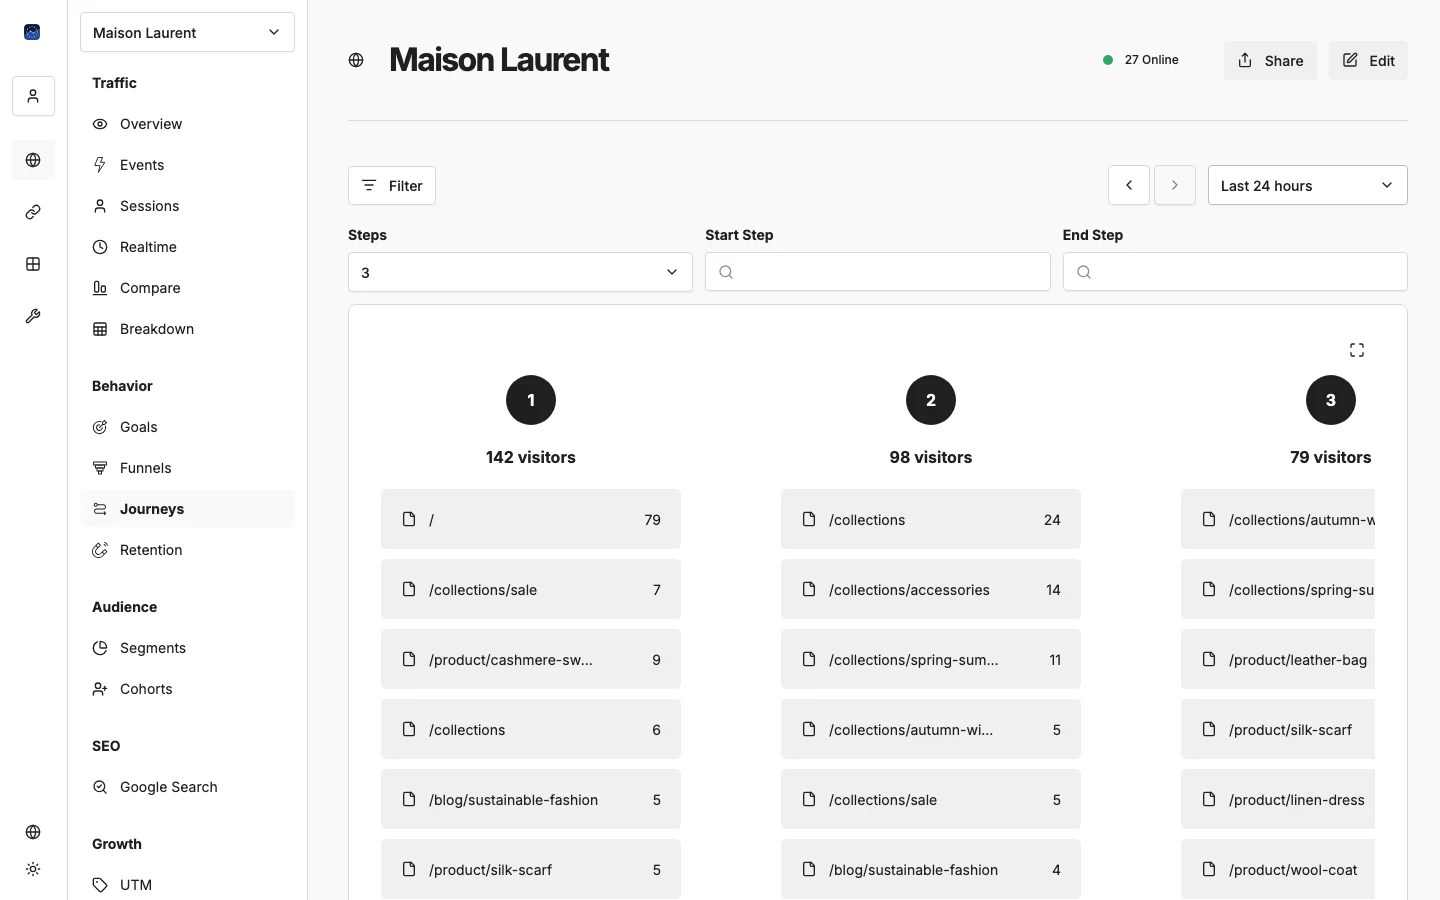
Configure these options:
- Number of steps: How many steps to track in the path (2 to 7). More steps reveal longer journeys but can get complex.
- Start step (optional): Filter to show only journeys that begin with a specific page or event. Great for analyzing what happens after visitors land on a specific page.
- End step (optional): Filter to show only journeys that end at a specific page. Useful for understanding what paths lead to a conversion page.
Reading the Sankey Diagram
The diagram shows:
- Columns: Each column represents a step in the journey (Step 1, Step 2, Step 3, etc.)
- Nodes: Boxes within each column represent individual pages or events. The box shows the page name, an icon (file for pages, lightning bolt for events), and the visitor count.
- Connections: Lines between nodes show visitor flow. Wider lines = more visitors taking that path.
- Drop-off: Hover over a node to see the drop-off percentage (in red) and the conversion percentage (in green).
Interactive Features
- Click a node to filter and see only the paths going through that page
- Hover over connections to see exact visitor counts
- Full-screen mode for complex diagrams with many paths
Practical Examples
Example 1: Where do homepage visitors go?
Set the start step to / (homepage) and use 4 steps. You’ll see the most common paths visitors take after landing on your homepage.
Example 2: How do people reach the pricing page?
Set the end step to /pricing. Now you can see all the different paths that lead to your pricing page and optimize the most common ones.
Example 3: Full website flow
Leave both start and end empty with 5–7 steps to see the overall navigation patterns across your entire site.
What’s Next?
Need help? Reach out to us at support@eurometrics.eu.