Breakdown Reports: Slice Your Data Any Way You Want
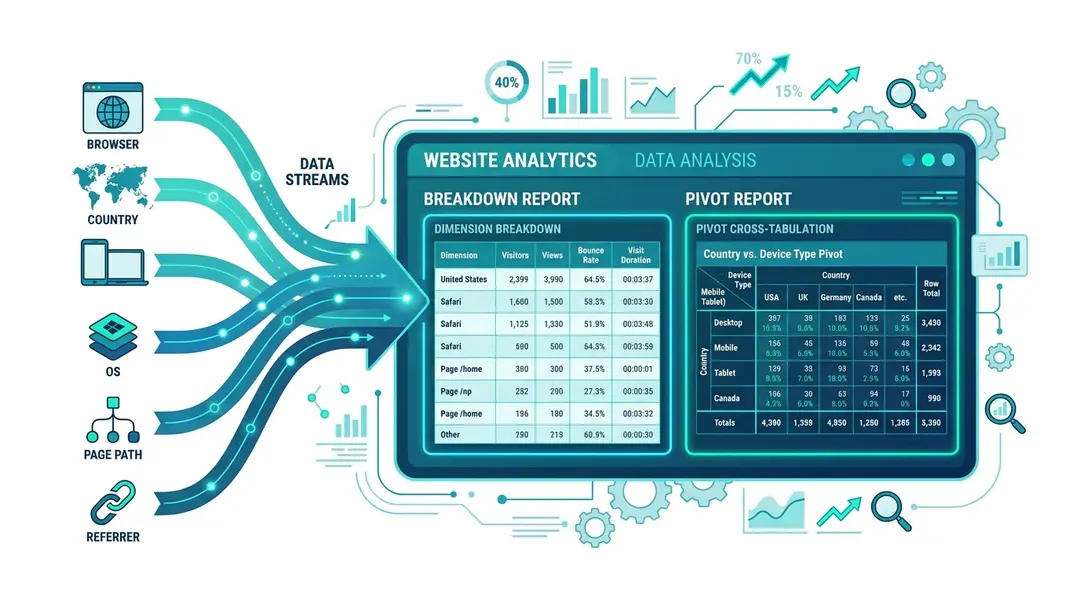
Breakdown reports let you analyze your traffic by any combination of dimensions. Want to see page views broken down by browser and country? Visitors by device and operating system? Breakdown gives you that flexibility.
Creating a Breakdown Report
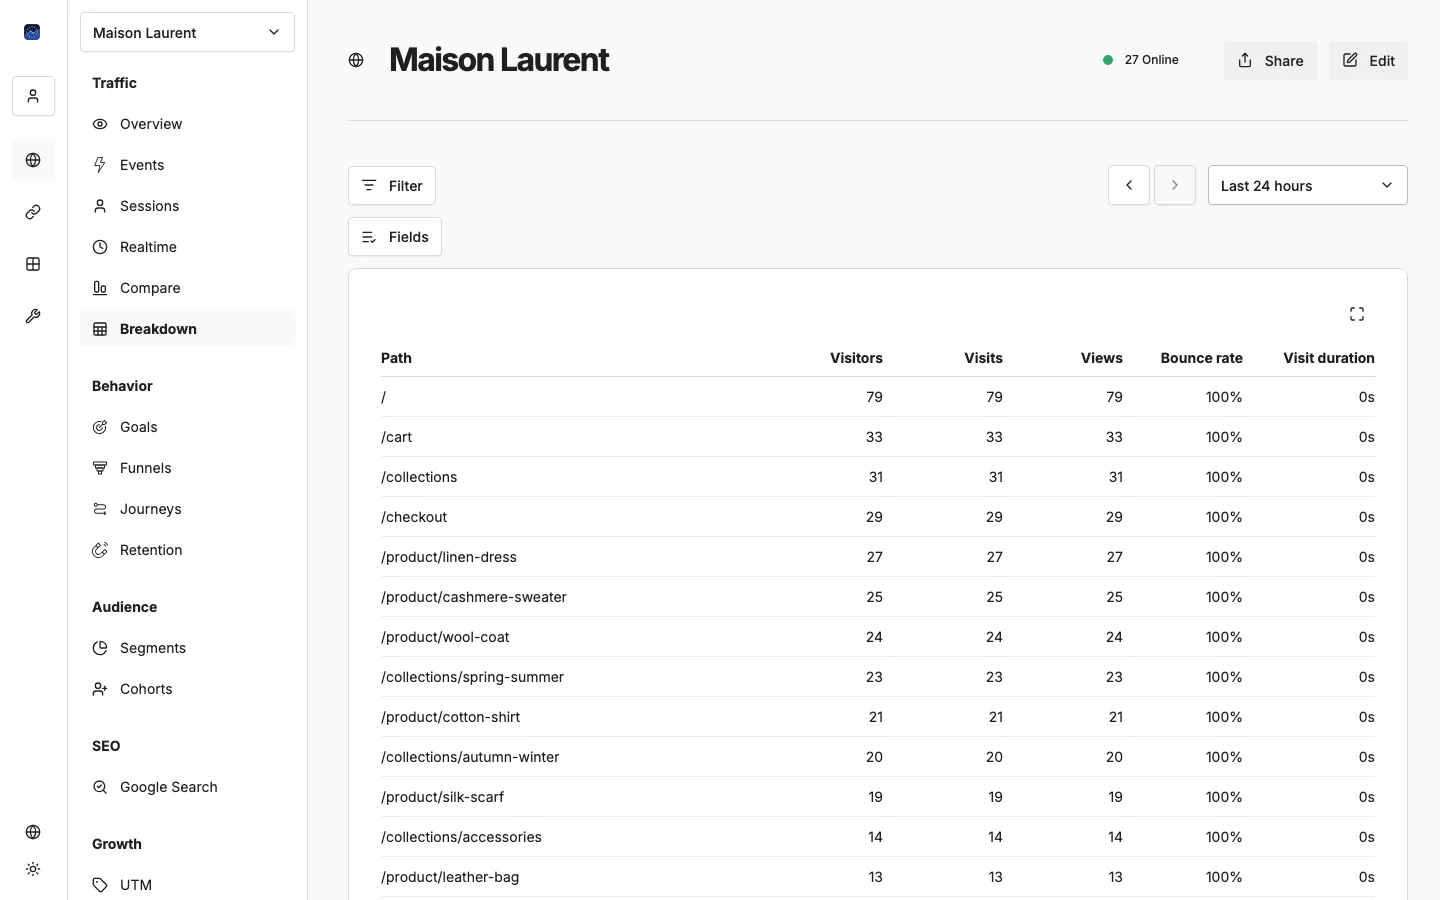
Navigate to Breakdown in the sidebar under Traffic, then click Create Report.
Select one or more fields to break down by:
- Content: Page path, Page title, Hostname, Query string
- Acquisition: Referrer, Tag
- Audience: Browser, OS, Device, Country, Region, City, Language
- Behavior: Event name
Reading Breakdown Results
The table shows your selected dimensions plus these metrics:
- Visitors: Unique visitor count
- Visits: Session count
- Views: Page view count
- Bounce Rate: Percentage of single-page sessions
- Visit Duration: Average session length
Click any column header to sort. The report can show up to 500 rows.
Pivot Reports: Cross-Tabulate Two Dimensions
Pivot tables take two dimensions and create a matrix showing how they relate to each other. Think of it as a spreadsheet pivot table for your web analytics.
Creating a Pivot Report
Navigate to Pivot in the sidebar under Traffic, then click Create Report.
Configure:
- Row field: The dimension for rows (e.g., Referrer)
- Column field: The dimension for columns (e.g., Landing Page)
- Metric: What to count: Visitors, Visits, or Views
Reading Pivot Results
The table shows:
- Row labels in the first column (top 50 values)
- Column headers across the top (top 10 values, with an “(other)” column for the rest)
- Cell values showing your selected metric
- Row totals on the right
- Column totals at the bottom
- Grand total in the corner
Pivot Report Ideas
Rows | Columns | Metric | Insight |
|---|---|---|---|
Referrer | Landing Page | Visitors | Which sources send traffic to which pages? |
Country | Device | Visitors | Do mobile/desktop preferences vary by country? |
Browser | OS | Views | What browser-OS combinations are most common? |
Page Path | Referrer | Views | Which pages get traffic from which sources? |
Breakdown vs. Pivot: Which to Use?
Feature | Breakdown | Pivot |
|---|---|---|
Dimensions | 1 or more in a flat list | Exactly 2, in a matrix |
Output | Table with metrics columns | Cross-tabulation grid |
Best for | Detailed segment analysis | Seeing relationships between two things |
Max rows | 500 | 50 rows × 10 columns |
What’s Next?
Need help? Reach out to us at support@eurometrics.eu.