What Is Attribution?
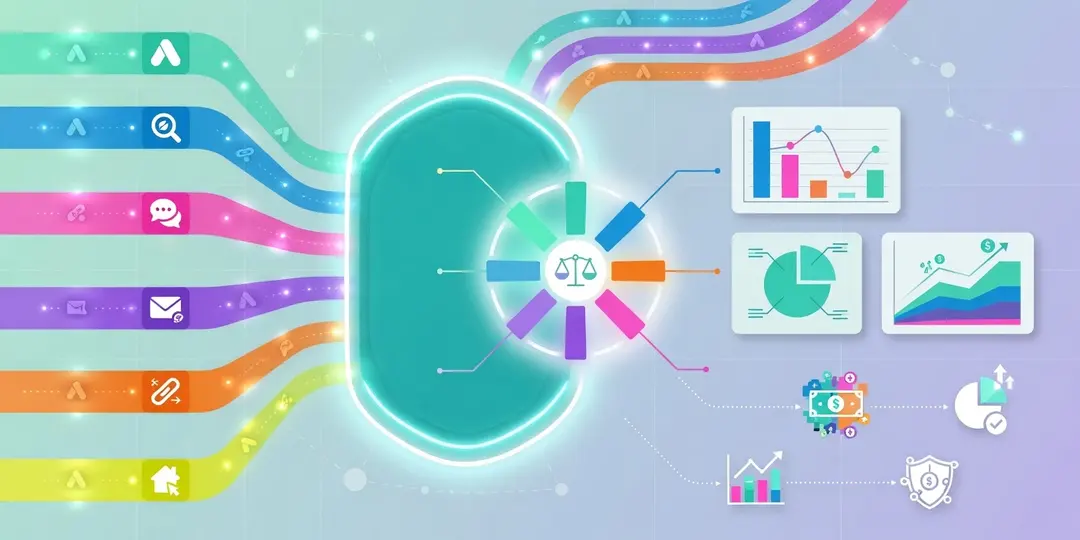
Attribution answers a deceptively simple question: which traffic source deserves credit for a conversion? Most analytics tools give all the credit to the last click before the sale. That single choice quietly drains the channels that actually start the customer journey (content, brand advertising, social) and shifts budget toward the channels that merely finish it. Multi-touch attribution fixes this by distributing conversion credit across every touchpoint the customer really passed through.
The Problem We Solve
Picture a typical buyer journey:
- A person sees your ad in Google. They click, look around, leave.
- Three days later they find a blog article through search. They read, but don’t buy.
- A week later they see a retargeting ad on Facebook or Instagram, and they come back.
- Two days after that they type your address directly and buy.
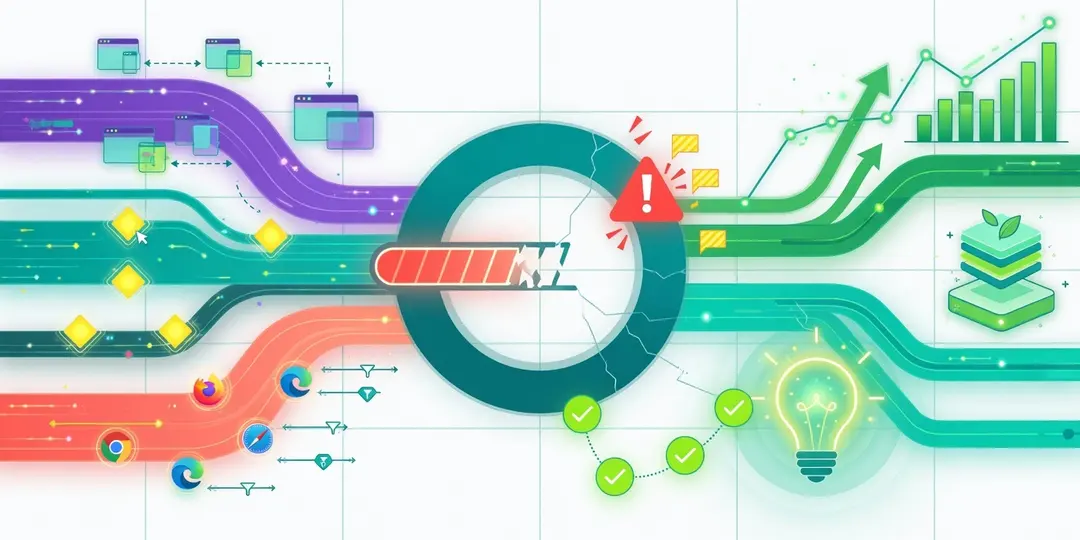
In most analytics systems all the credit goes to the last click: the direct visit. Google Ads, the blog and the social ad get zero. The marketer opens the report and thinks: “Why spend money on ads if people come directly anyway?” Campaigns get switched off. Two months later sales fall. The price of wrong attribution is budget cut from the channels that were actually working.
What Is a Touchpoint?
Every time a user arrives at your site from a new source, that is a touchpoint. A source can be:
- Paid advertising (Google Ads, Meta, TikTok, LinkedIn, Microsoft)
- Organic search
- A referral link from another site
- An email campaign with UTM tags
- A direct visit
- Any UTM channel you have set up
Multi-touch attribution tracks the whole chain of touchpoints (not just the last link) and fairly distributes conversion credit across the channels that took part in it.
How EuroMetrics Compares to GA4
GA4 has attribution, but with limitations that matter for honest reporting. Here is the difference:
Capability | Google Analytics 4 | EuroMetrics |
|---|---|---|
Attribution models | Data-driven (default), Last Click, First Click, Linear, Position-based, Time Decay | First Click, Last Click, Linear, U-Shaped, Time Decay. Transparent, deterministic, switched in one click |
Lookback window | Capped at 30 or 90 days depending on conversion type | Driven by your report date range, with no artificial ceiling |
Cookies & consent | Works on cookies by default. Under GDPR a consent banner is required; people who decline drop out of analytics. | Cookieless by design. With a compatible setup no consent banner is required. Every visitor is counted. |
Data retention | User data deleted after 2 or 14 months | You decide retention; data stays in the EU on your terms |
Where data lives | Processed by Google, may be transferred to the US | Hosted entirely in the EU |
Sampling | Large volumes may be reported on a sample | No sampling: all data, in every report |
Model transparency | Data-driven is a black box; weights are hidden | Every model is documented and predictable. Any number can be re-checked by hand. |
What this means in practice. If a third of your modern traffic declines cookies, those people simply don’t exist for GA4. Their journey is invisible, first touch to last. EuroMetrics sees every visitor and attributes every conversion, while you decide how to weight each channel’s contribution.
The Five Attribution Models
EuroMetrics has five built-in attribution models. None of them is “correct” in an absolute sense; each answers a different question. Use them in combination.
1. First Click: the awareness model
All the credit goes to the first source that brought the user to your site.
When to use it. You are launching a new product or entering a new market and want to know which channels best introduce your brand to a fresh audience.
Example. A B2B SaaS company spends €2,500/mo on Google Ads, €1,700 on LinkedIn and €1,300 on content. Over a quarter it closes 60 deals. By First Click, LinkedIn brought 28 of those customers, Google Ads 18, content 14. By Last Click, LinkedIn would have looked like a channel that produced just 6 deals, when in reality it was the front door for half the pipeline.
2. Last Click: the closer model
All the credit goes to the last source before the conversion. This is the standard in most classic analytics systems, including Universal Analytics.
When to use it. You only care about the final push — what made the person click “Buy” right now.
The systemic problem. Last Click chronically undervalues every top-of-funnel channel. Blogs, SEO, display advertising, podcast sponsorships and brand campaigns will always look weaker than they are, simply because, by definition, they are rarely the last step.
Example. An e-commerce store sees that 65% of Last-Click conversions come from “direct” visits. The team decides paid traffic doesn’t work and halves the Google Ads budget. Three months later direct traffic is down 40% and revenue has fallen by €72,000/mo. The cause: it was Google Ads that built the awareness which produced those direct visits.
3. Linear: the equal-credit model
Credit is split equally across every touchpoint.
When to use it. As a baseline. Linear is a good starting point when you don’t yet know which channel does what: it removes the structural bias toward the first or last touch.
Example. A journey has three touchpoints: a paid search ad, a blog article and a newsletter email. By Linear each gets 33.3% of the conversion value. If the order was worth €120, the ad, the content and the email each receive €40.
Why it matters. Mid-funnel channels (email narrative, retargeting, organic content) finally get credit for the work they really do. Marketers stop quietly draining the part of the funnel that holds a customer between first interest and purchase.
4. U-Shaped: the position-based model
The first touch gets 40% and the last touch gets 40%. The remaining 20% is split equally across all the touches in between. (With a single touch it gets 100%; with two touches they split 50/50.)
When to use it. The best default for most e-commerce and SaaS businesses. It rewards both the moment of discovery and the moment of purchase, while the middle of the funnel still gets a visible share.
Example. A €160 conversion has four touches: an ad (first), a blog, an email, and a direct visit (last). By U-Shaped the ad gets €64 (40%), the direct visit €64 (40%), and the blog and email split €32, €16 each. Compare that with Last Click, where direct would take the full €160 and the other three channels would show zero.
5. Time Decay: the recency model
The closer a touchpoint is to the moment of conversion, the more weight it gets. Weight decays exponentially with a half-life of 7 days.
When to use it. Long sales cycles. B2B, consulting, complex and expensive purchases, enterprise software: anything where a deal takes weeks or months and the “closing argument” matters more than the “opening” one.
Example. A B2B deal closes over 45 days with five touches: a webinar (day −45), a whitepaper download (day −30), an email (day −10), a sales demo (day −3), and a direct visit (day 0). By Time Decay with a 7-day half-life the webinar gets about 1% of the credit, the whitepaper 4%, the email 28%, the demo 33%, and the direct visit 34%. This shows clearly which channels do the final work in long cycles, and where to invest at the bottom of the funnel.
Choosing a Model: Quick Reference
Model | Best for | Watch out for |
|---|---|---|
First Click | Launching a new product, awareness analysis, top-of-funnel investment | Undervalues the channels that actually close deals |
Last Click | Direct-response campaigns, performance marketing in isolation | Systematically understates content, SEO and brand |
Linear | Baseline analysis, a fair read on mid-funnel work | Treats incidental and decisive touches as equal |
U-Shaped | E-commerce, SaaS, most B2C (the best default) | Less useful when journeys consistently exceed 6–8 touches |
Time Decay | B2B, long sales cycles, consulting, complex purchases | Undervalues top-of-funnel work happening months before the close |
Creating an Attribution Report
Open Attribution in the sidebar (under Growth) and configure the report:
- Attribution model: choose one of the five models above. They are shown as selectable cards (First click, Last click, Linear, U-Shaped, Time Decay); switching model recalculates the report instantly.
- Conversion type & step: what counts as a conversion: a page view (e.g.
/thank-you) or an event (e.g.purchase). See Tracking Conversion Goals. - Attribution scope: Session (default) chains the touches within one visit; Visitor chains touches across all of a visitor’s sessions, for a true multi-session view.
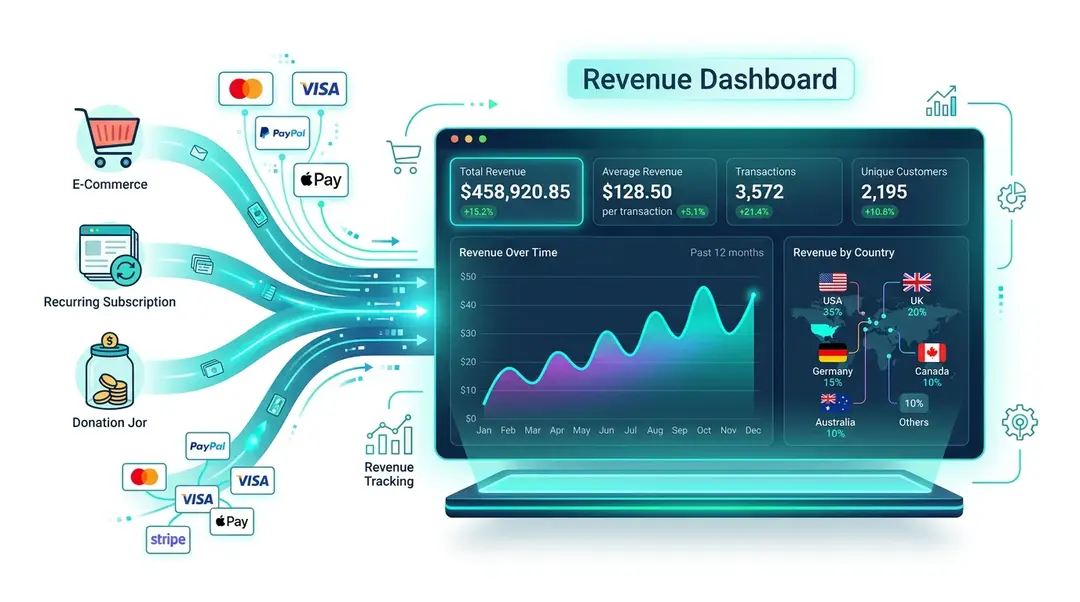
Conversions or revenue. If your website has a currency configured and you track revenue, the report distributes the revenue value across channels using the selected model’s weights. Otherwise it distributes the conversion count. See Revenue Tracking.
Lookback. There is no artificial attribution window. The report considers every touch that occurred within your selected date range and before the conversion happened. Widen the date range to capture longer journeys.
Reading Attribution Results
The report shows summary metrics and a per-source breakdown.
Summary metrics
- Total Visitors: everyone who reached the conversion
- Total Visits: sessions that included the conversion
- Total Pageviews: page views in converting sessions
Source breakdown
- Referrers: which websites drove conversions
- Paid Ads: performance of paid channels
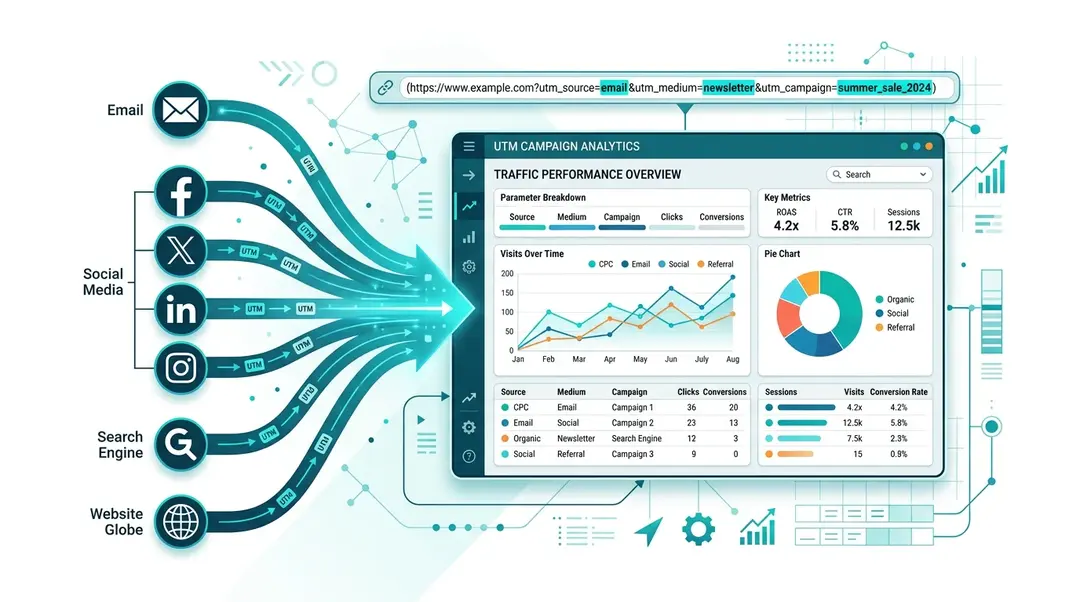
- UTM Sources: breakdown by utm_source, utm_medium, utm_campaign, utm_content, utm_term
Each row shows the source, the attributed credit (weighted conversions or revenue), and its share of the total. See UTM Campaign Analytics for more on tagging campaigns.
Practical Scenarios
Scenario 1. You are about to cut ad budget
Before switching anything off, open Linear or U-Shaped. If Google Ads has a high First-Click share but a low Last-Click share, that channel is doing the acquisition work for everyone else. Turn it off and direct, organic and email will sag at the same time.
Scenario 2. You are evaluating the ROI of your blog
SEO articles almost never get the last click. By Last Click a content program that actually influences €50,000 of monthly revenue might show €6,700. Switch to Linear to see the real contribution. If the gap is dramatic, your blog isn’t broken; your attribution is.
Scenario 3. You are planning next quarter’s budget
Compare First Click and Time Decay side by side. The first shows which channels best attract new audiences; the second shows which best close them. Allocate budget in proportion to each channel’s real role, not to a single number from a single model.
Scenario 4. You have launched a new email program
By Last Click email almost always looks weak — people rarely buy straight from an email. By U-Shaped you can see how often email becomes the middle touch that holds a customer’s interest between first contact and purchase. That is exactly what email is paid for.
The Key Takeaway
There is no “right” attribution model. There is a model that asks the right question for the specific decision in front of you. The real value is looking at several models at once and seeing the full picture: who brings customers in, who keeps them engaged, and who closes them.
A marketer who decides on Last Click alone is like a head of sales who pays a bonus only to whoever signed the contract and ignores everyone who worked the account for six months. The team quickly stops investing in long-term opportunities. Multi-touch attribution gives an honest answer to the question: what is your marketing budget actually paying for?
What’s Next?
Need help? Reach out to us at support@eurometrics.eu.